Figure 1.
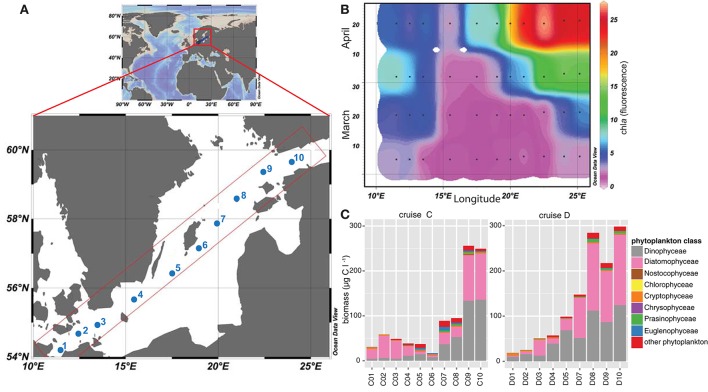
Map of the Baltic Sea illustrating the sampling stations included in this study. (A) The map demonstrates the Baltic Sea, within Europe, and the sampling transect over the Baltic Proper. Sampling stations during the four cruises (A–D) are labeled from 1 to 10, ranging from stations 1-3 in the southern and stations 8–10 in the northern coastal part of the Baltic Proper. Stations 4-7 were located in the open Baltic Proper. (B) Relative chla fluorescence [measured with the flow through system on board and modified from Godhe et al. (2016)] across the transects over the Baltic Proper from March to April 2013 (cruise A–D). Black dots describe sampling occasions, values were extrapolated using Ocean Data View. (C) Phytoplankton biomass in μg C l−1 during cruise C (early April) and D (late April) along the transect, based on microscopy counts.

