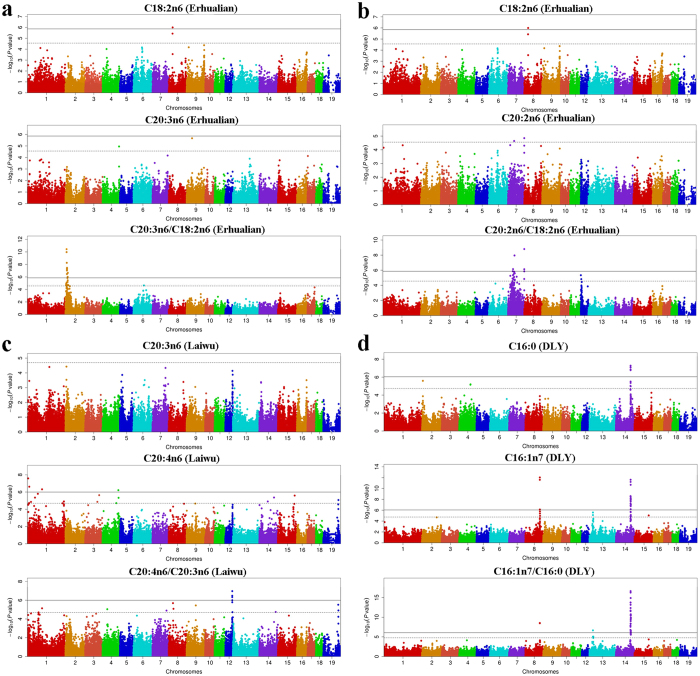
Figure 2. Manhattan plots of significant loci for fatty acid metabolic traits in the Erhualian, Laiwu and DLY populations.
(a) GWAS results for C18:2n6, C20:3n6 and C20:3n6/C18:2n6 in the Erhualian population; (b) GWAS results for C18:2n6, C20:2n6 and C20:2n6/C18:2n6 in the Erhualian population; (c) GWAS results for C20:3n6, C20:4n6, and C20:4n6/C20:3n6 in the Laiwu population; (d) GWAS results for C16:0, C16:1n7 and C16:1n7/C16:0 in the DLY population; Negative log10 P values of the qualified SNPs (N) are plotted against their genomic positions. SNPs on different chromosomes are denoted by different colors. The solid line represents the genome-wide threshold (0.05/N). The dash line indicates the suggestive threshold (1/N).

