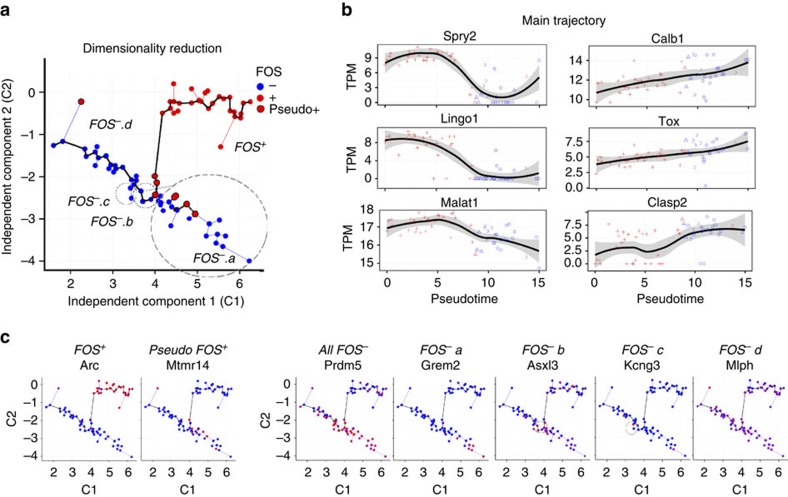
Figure 5. NE nuclei exist along a continuum of transcriptional states.
(a) Independent components based on analysis using Monocle with individual nuclei coloured by FOS protein staining. Pseudo-FOS+ nuclei (red with black outline) segregate towards the border of FOS+ (red) and FOS− (blue) nuclei. (b) The top genes associated with pseudotime exhibit continuous patterns of expression linking FOS+ (red) and FOS− nuclei (blue). (c) Expression based on cluster, high expression=red, low expression=blue.

