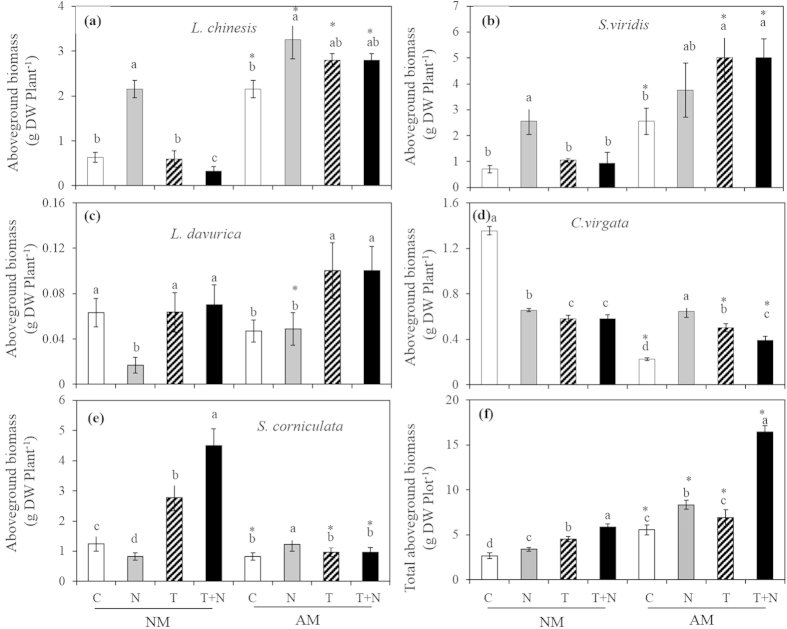
Figure 3. The effects of AMF on plant biomass under N addition and elevated temperature in the greenhouse experiment.
(a) L. chinensis; (b) S. viridis; (c) L. davurica; (d) C. virgata; (e) S. corniculata; (f) Total aboveground biomass. The lowercase letters in each column represent significant difference (P < 0.05) among different treatments in the same AMF treatment. Asterisks represent significant difference (P < 0.05) between with and without AMF treatments in the same N, T or T + N treatments.

