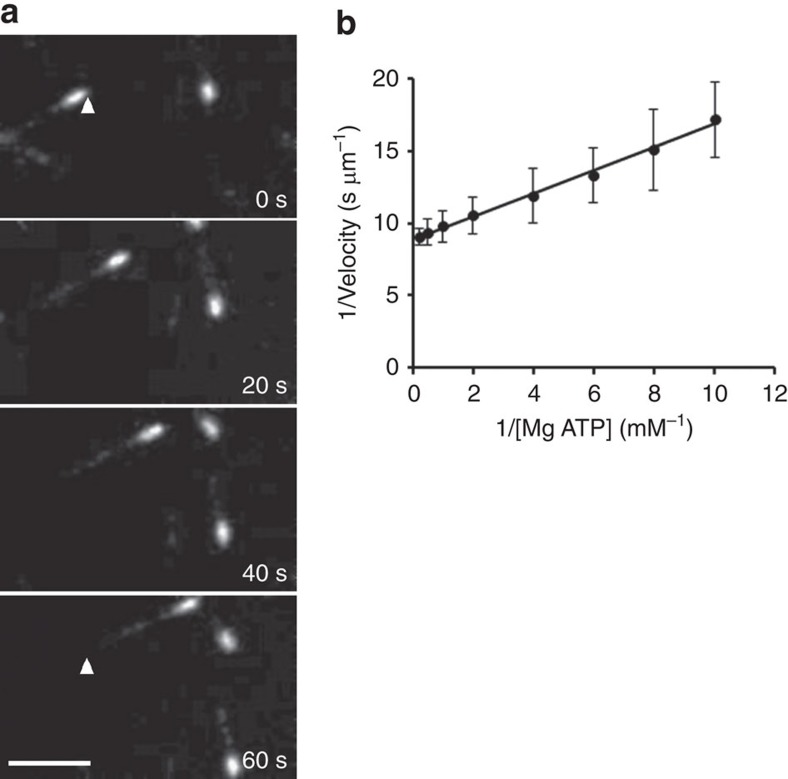
Figure 4. Characterization of recombinant centralspindlin.
(a) MT gliding assay of purified centralspindlin. Fluorescence images of MTs moved by centralspindlin immobilized on a coverslip. Polarity-marked MTs (minus-end brighter) move in the gliding assays with velocities of 0.10 μm s−1. To judge movement, the arrowhead is positioned in the same spot in the first and last panels. MTs move with their minus-end leading, demonstrating that centralspindlin is a plus-end-directed motor. Scale bar, 5 μm. (b) Lineweaver–Burk plot displaying the effect of MgATP on MT motility. MT gliding velocities were measured in the presence of increasing MgATP concentrations and plotted as 1/velocity versus. 1/[MgATP]. This figure displays data from one experimental set, which had a measured apparent Km=0.089 mM for MgATP with a Vmax of 0.11 μm s−1 (r2=0.99). Each point of 1/velocity was obtained from 15 independent MT moving events and given as average±s.d. in the plot.

