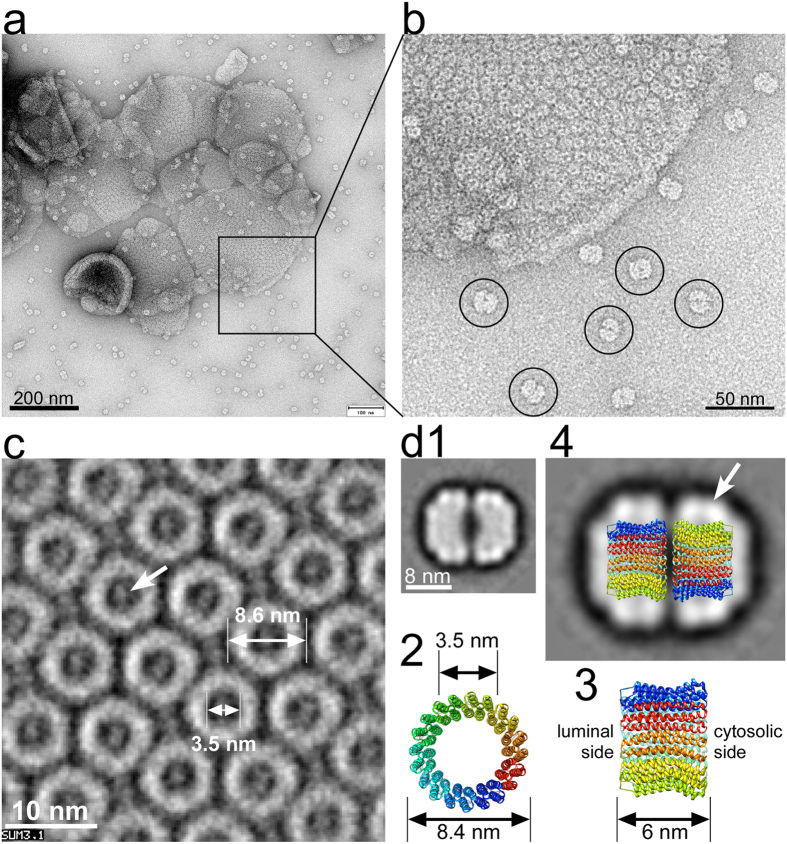
Figure 3. 2-D crystallization and single-particle image analysis of c-ring.
For 2-D crystallization, c-ring (1.5 mg/ml) was mixed with DOPC (0.5 mg/ml) and detergent was removed by the addition of BioBeads. (a) Negative stain TEM of DOPC reconstituted c-ring after detergent removal for 7 days. At this stage, para-crystalline arrays of c-rings were visible, but reconstitution was incomplete with numerous dimeric c-ring complexes visible next to lipid vesicles (see molecules highlighted by circles in (b)). (c) Reconstituted c-rings after complete detergent removal were imaged by cryo-EM and crystalline areas were analyzed by correlation averaging. (d1) Averaged projection (367 images) of dimeric c-ring. A dataset of 4337 images of dimeric c-rings from images, as shown in (b) was analyzed by reference free alignment and classification, as implemented in EMAN1.9. (d2,3) Top- and side-view of a bacterial V-ATPase c-ring (K10 ring from E. hirae; 2bl2.pdb)31. (d4) Model of the dimeric yeast V-ATPase c-ring superimposed on the EM average. The stain-excluding detergent belt is indicated by the arrow.

