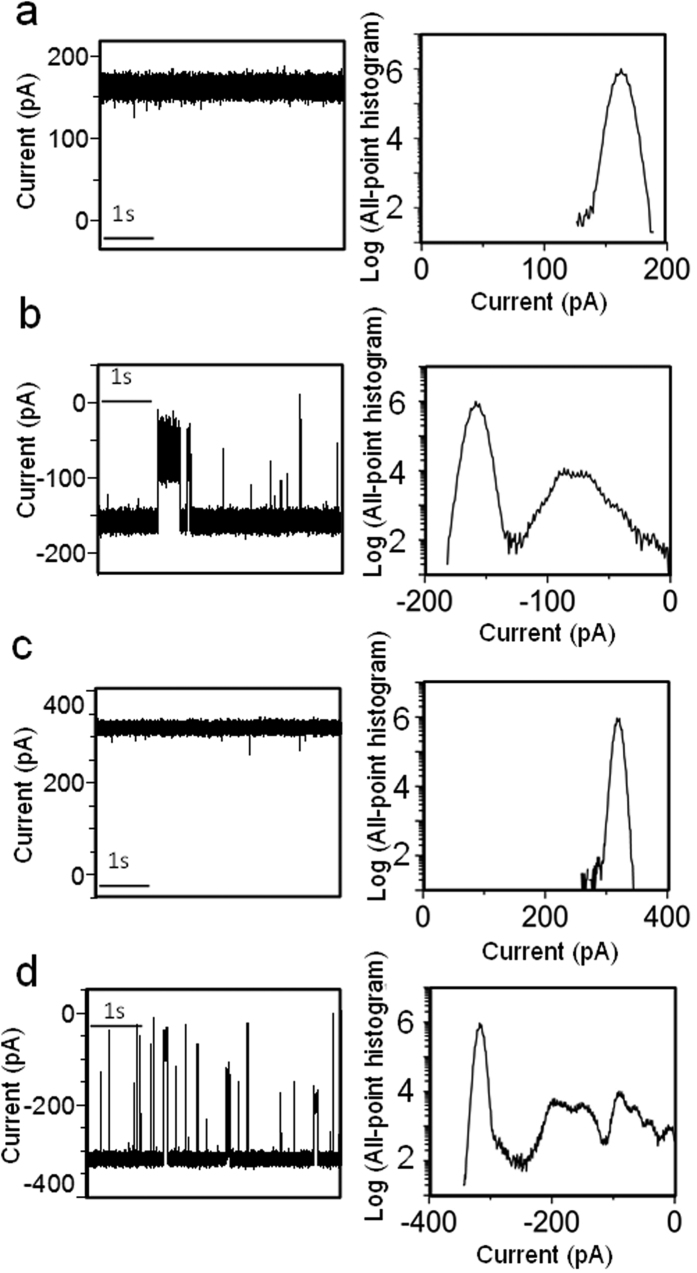
Figure 4. Representative single-channel electrical traces along with their corresponding semi-logarithmic all-point, current-amplitude histograms.
The traces were acquired with the c-ring at various applied transmembrane potentials. (a) +20 mV. (b) −20 mV. (c) +40 mV. (d) −40 mV. All single-channel traces were low-pass Bessel filtered at a frequency of 10 kHz. These electrical traces are typical among n = 8 distinct single-channel electrical recordings.

