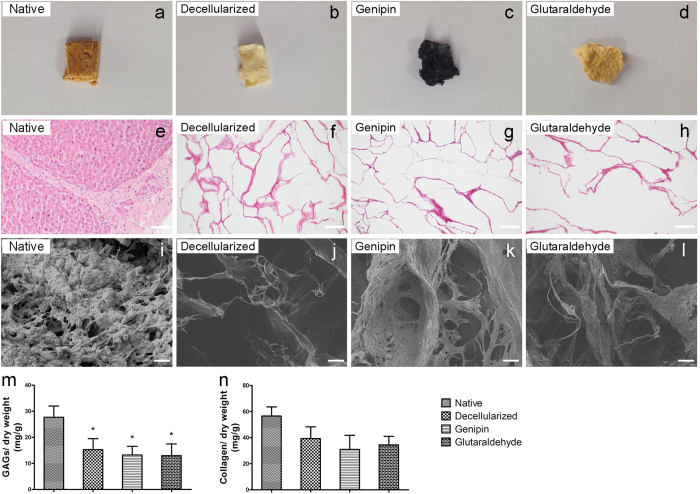
Figure 2. Morphological and quantitative analysis of liver materials.
(a–d) Macroscopic appearance of native liver, decellularized liver ECM, genipin-fixed ECM and glutaraldehyde-fixed ECM. (e–h) Histological images of liver samples stained with H&E after dehydration and sterilization processes. Scale bars = 100 μm. (i–l) Scanning electron microscopy of the liver materials. Scale bars = 20 μm. (m) The concentration of GAGs in the liver materials. (n) The concentration of collagen in the liver materials. The collagen and GAG contents were normalized to the initial dry weight of the sample. *p < 0.05 with respect to the native liver group. All data are given as the mean ± SEM.

