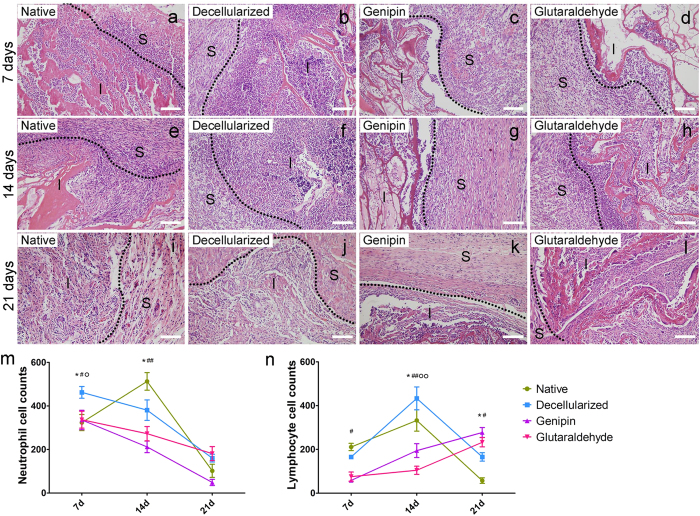
Figure 4. Histologic analysis of the liver xenografts.
(a–l) The host immune responses towards native liver, decellularized liver ECM, genipin-fixed ECM, and glutaraldehyde-fixed ECM at 7 days, 14 days, and 21 days post-surgery are shown. Scale bars = 100 μm. The dotted line indicates the border of the implants and surrounding tissue. Abbreviations: S = surrounding tissue; I = implanted porcine liver materials. (m,n) Quantification of neutrophil and lymphocyte infiltration. The numbers of cells were counted in at least five different areas for each slide. *p < 0.05 with respect to the native group compared to the decellularized group; #p < 0.05 with respect to the genipin group compared to the decellularized group; ##p < 0.01 with respect to the genipin group compared to the decellularized group; op < 0.05 with respect to the glutaraldehyde group compared to the decellularized group; oop < 0.01 with respect to the glutaraldehyde group compared to the decellularized group. All data are given as the mean ± SEM (n = 3/each group).

