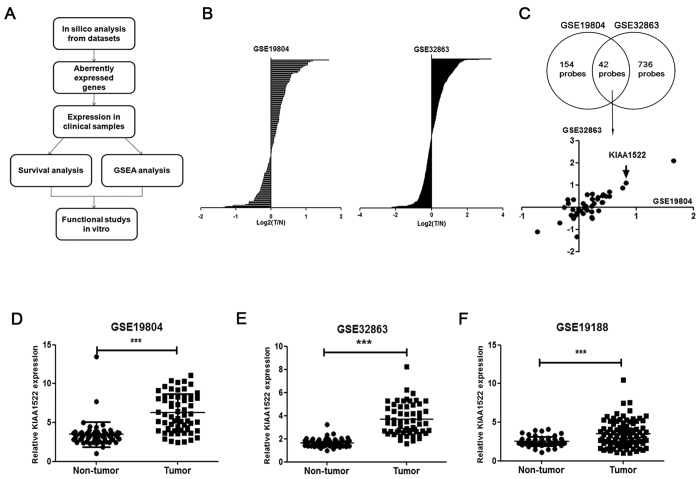
Figure 1. Identification of KIAA1522 as an overexpressed gene in NSCLC.
(A) The flow chart of the present work. (B) Screen of uncharacterized genes (genes without GO function annotation) in GSE19804 and GSE32863 datasets. For each selected probe, the average value of log2 (Tumor/Non-tumor) was calculated and shown in the rank order. (C) The average values of log2 (Tumor/Non-tumor) of the genes presented in both GSE19804 and GSE32863 datasets were shown. (D–F) Transcript levels of KIAA1522 in non-tumor tissues and NSCLC tissues from GSE19804 (D), GSE32863 (E) and GSE19188 (F) datasets. Data are represented as scatter dot plot with mean ± s.d. (by t-test analysis, ***P < 0.001).

