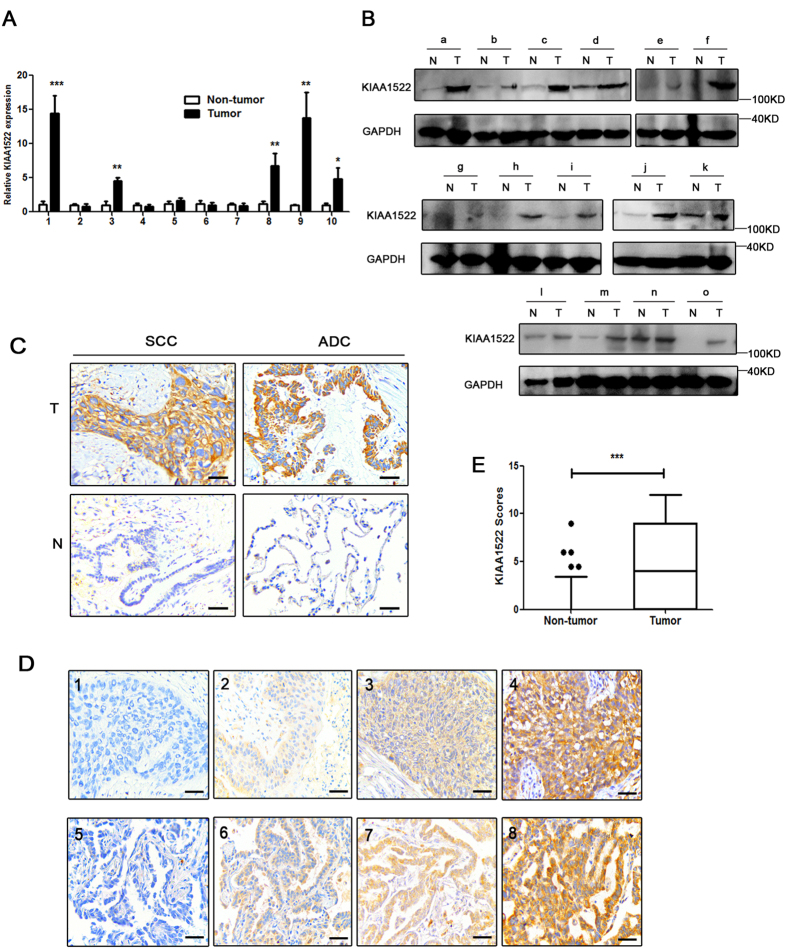
Figure 2. Expression status of KIAA1522 protein in NSCLC tissue samples.
(A) The mRNA levels of KIAA1522 in 10 pairs of NSCLC tissue samples relative to their adjacent non-malignant tissues measured by real-time PCR. The expression of GAPDH mRNA was used as loading control in the real-time PCR analysis. (B) Western blotting analysis of KIAA1522 protein levels in NSCLC tissue samples (T) and the matched non-tumor tissues (N). GAPDH was used as loading control in the immunoblotting assays. (C) Representative examples of high (positive) and low (negative) expression of KIAA1522 in SCC or ADC samples and their adjacent non-malignant tissues. (D) Representative immunohistochemical microphotographs of KIAA1522 with negative (1,5), weak (2,6), moderate (3,7) and strong (4,8) expression. The subtypes are SCCs (1–4) and ADCs (5–8). Bar = 100 μm. (E) The expression scores indicating the protein levels of KIAA1522 for NSCLC and non-tumor lung tissues. Boxes represent the upper and lower quartiles and median; whiskers show the data points that are neither lower than the first percentile nor greater than the 99th percentile (by Mann-Whitney test analysis, ***P < 0.001).

