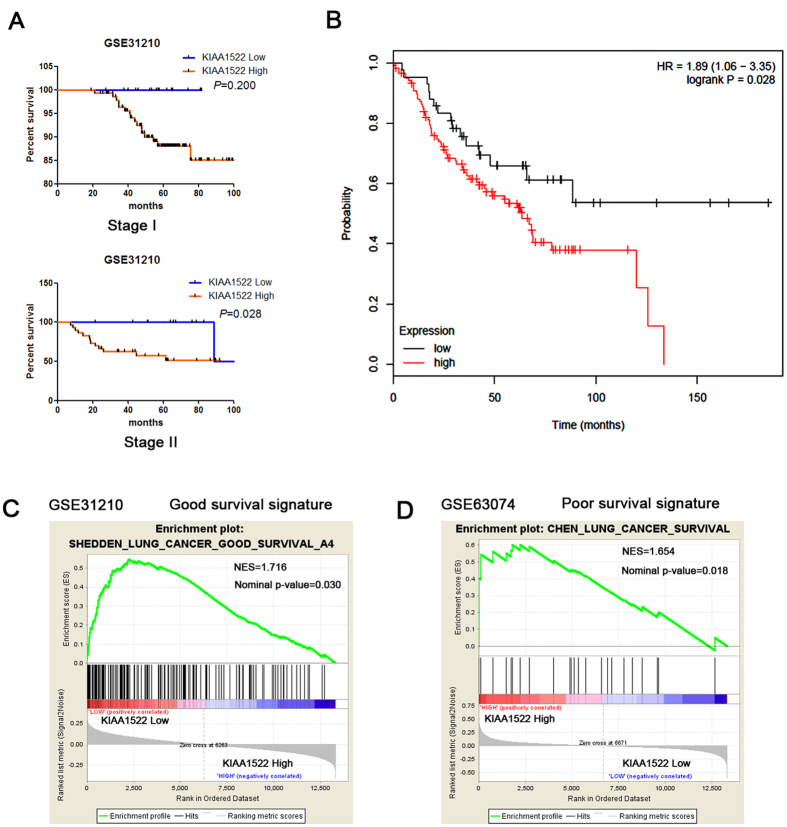
Figure 3. Correlation of KIAA1522 mRNA in NSCLC tissues and patients’ survival/survival signatures.
(A) Kaplan-Meier curves showing the survival percentage of patients with high KIAA1522 mRNA and low KIAA1522 mRNA levels in stage I and II patients in the dataset GSE31210. Samples with incomplete resection or adjuvant therapy were excluded for prognosis analysis. P values are shown in the graph, by log-rank test. (B) Survival analysis of the stage II lung cancer patients with KIAA1522 high and low expression using the Kaplan-Meier Plotter website for lung cancer (Version 2015). (C,D) Gene set enrichment analysis in GSE31210 showed that the genes within a good survival signature were observed to enrich in the groups with low KIAA1522 expression (C), while analysis in GSE63074 illustrated the enrichment of poor survival signature genes in the subset of high KIAA1522 expression group (D).

