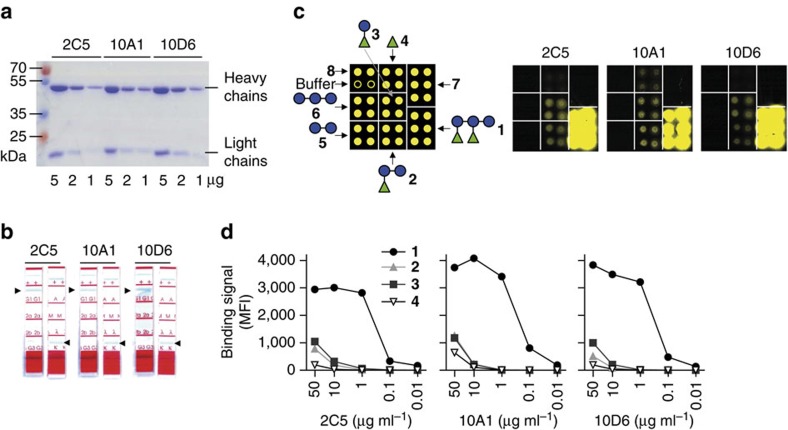
Figure 4. Characterization and epitope recognition patterns of anti-PS-I mAbs.
(a) SDS–PAGE analysis of the purified mAbs showing bands corresponding to heavy and light IgG chains. (b) Isotyping analysis of the three mAbs. (c) Spotting pattern and representative microarray scans of purified mAbs at 10 μg ml−1. See Supplementary Fig. 2 for details. (d) Glycan microarray-inferred binding signals to selected PS-I antigens (1–4) expressed as background-subtracted mean fluorescence intensities (MFIs) are shown.

