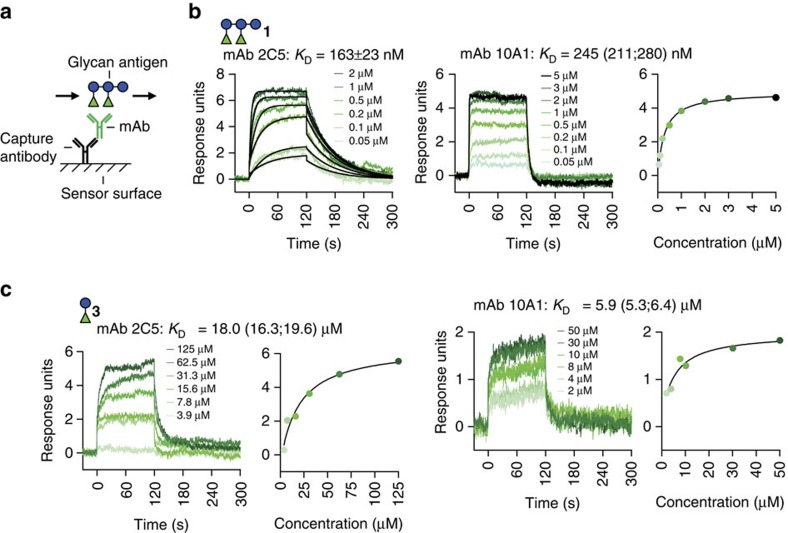
Figure 5. KD values of anti-PS-I mAbs binding to 1 and 3 inferred by SPR.
(a) mAbs were captured with an anti-mouse IgG antibody immobilized on the SPR sensor surface. Glycan antigens were passed over the surface to monitor changes in the response unit signals8. (b,c) Representative sensorgrams showing reference-subtracted binding signals to 1 (b) and 3 (c). KD values were calculated by fitting the curves to a 1:1 Langmuir binding model (black overlaid curves) or with a steady-state affinity model (response units versus concentration plots). Indicated KD values are mean±s.e.m. of n=3 or mean with minimum and maximum values in parentheses of n=2 independent experiments. See Supplementary Figs 3–5 for details.

