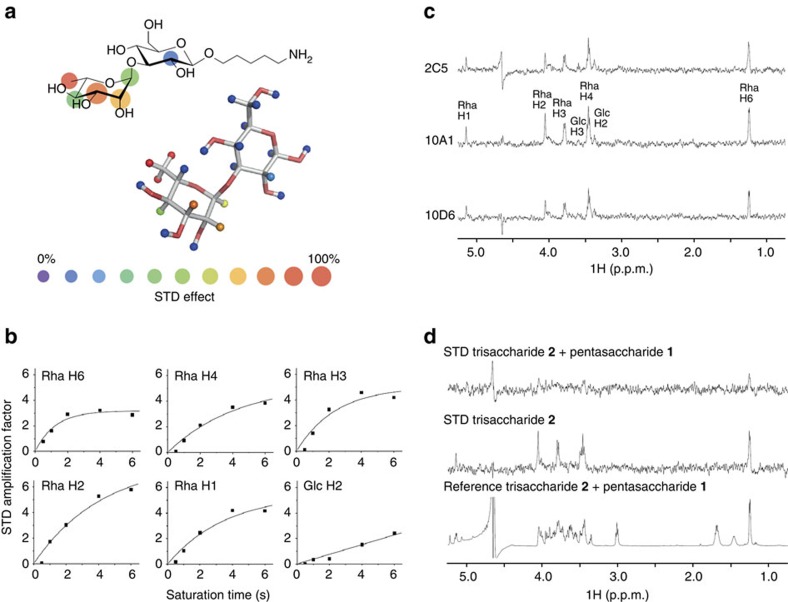
Figure 6. Epitope mapping of glycan–mAb interactions by STD-NMR.
(a,b) Recognition of disaccharide 3 by mAb 10A1 shown as Lewis structure and three-dimensional model calculated with Glycam70. Colours indicate percentages of STD effects28. (c) Recognition patterns of 3 by three mAbs. STD spectra were acquired at 2 s saturation transfer time in the presence of mAbs 2C5, 10A1 and 10D6 (from top to bottom). (d) Competition of trisaccharide 2 by pentasaccharide 1. Compound 2 exhibits STD effects on the same protons as 3 (middle panel). Addition of 1 resulted in the disappearance of the peaks imposed by 2, indicating competition for the same binding site (upper panel). The lower panel shows the reference spectrum.

