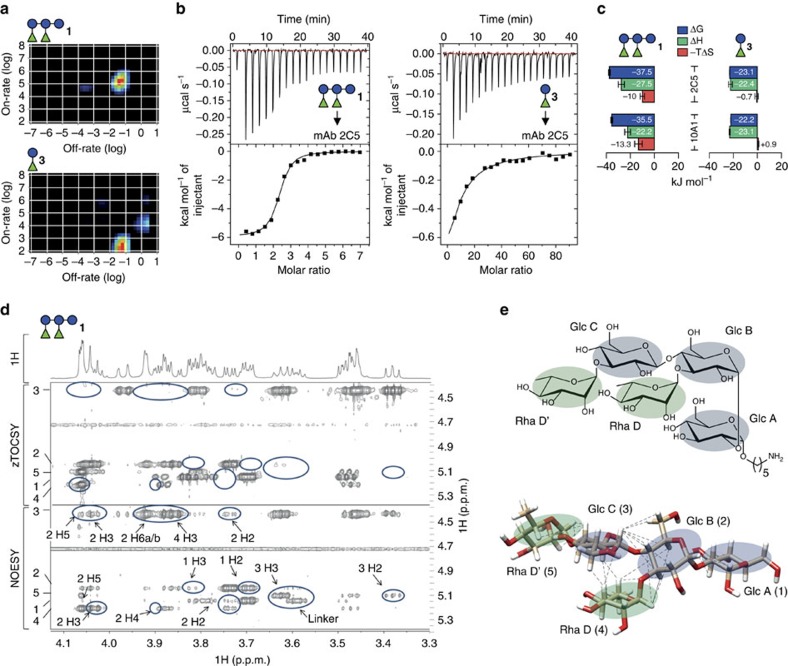
Figure 7. IM and thermodynamic analysis of glycan–mAb interactions and conformation of 1.
(a) IM analysis. The heat maps represent on- and off-rates of mAb 2C5 to 1 (upper) and 3 (lower). (b) Thermograms acquired using 7 μM of mAb 2C5 and titrating 250 μM of 1 (left) or 3 mM of 3 (right) at 25 °C. Thermodynamic parameters were inferred by nonlinear least-square fits of the data points. (c) Summary of thermodynamic parameters for 1 and 3 interacting with mAbs 2C5 and 10A1. Bars represent mean±s.e.m. of two independent measurements. See Supplementary Fig. 6 for details. (d) One-dimensional proton NMR spectrum, and 2D zTOCSY and NOE spectroscopy (NOESY) NMR spectra of 1 showing the coupled protons to the anomeric protons of the five residues with numbering according to the structure shown in e. Blue circles mark cross-peaks that appear in the NOESY spectrum, whereas not showing a corresponding peak in the zTOCSY. These peaks were marked as inter-residue NOEs and labelled by residue number and proton name. (e) Chemical structure (upper) and three-dimensional model of 1 obtained by using GLYCAM31,63 (lower). Glucose and rhamnose residues are highlighted blue and green, respectively. Dotted lines represent 23 inter-residue NOEs derived from a comparison of NOESY and zTOCSY spectra. All collected NOEs are within the 5-Å distance limit in the model structure (see Supplementary Table 1 for details).

