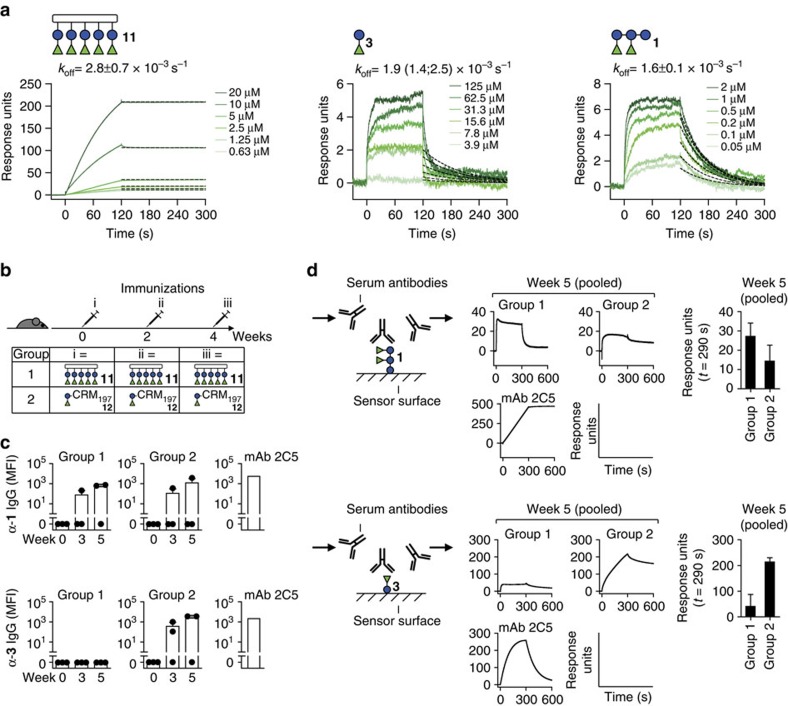
Figure 8. Antigenicity of multivalently displayed minimal glycan epitopes of PS-I.
(a) SPR sensorgrams of mAb 2C5 binding to construct 11 that pentavalently presents the minimal disaccharide glycan epitope. For comparison, sensorgrams of the same antibody to disaccharide 3 and pentasaccharide 1 are shown. Avidities were estimated by fitting off-rate curves with a dissociation model (black dashed lines). The off-rate values koff are mean±s.e.m. of n=3 or mean with minimum and maximum values in parentheses of n=2 independent measurements. (b) Mice were immunized with 11 (group 1) or glycoconjugate 12 (group 2) at the indicated time points. (c) Glycan microarray-inferred serum IgG levels to 1 (upper) and 3 (lower) of immunized mice expressed as mean fluorescence intensity (MFI) values. Bars represent mean+s.d. of three mice. Values of individual mice are shown as black dots. (d) SPR-inferred serum antibody responses to 1 (upper) and 3 (lower) in immunized mice. The experimental set-up is shown to the left. Average sensorgrams (two independent measurements) of pooled sera at week 5 post immunization subtracted by week 0 signals are shown in the centre. The bar graphs on the right show response unit signals at t=290 s (mean+s.e.m. of two independent measurements). See Supplementary Note 2 and Supplementary Figs 11–13 for details on the data presented in b–d.

