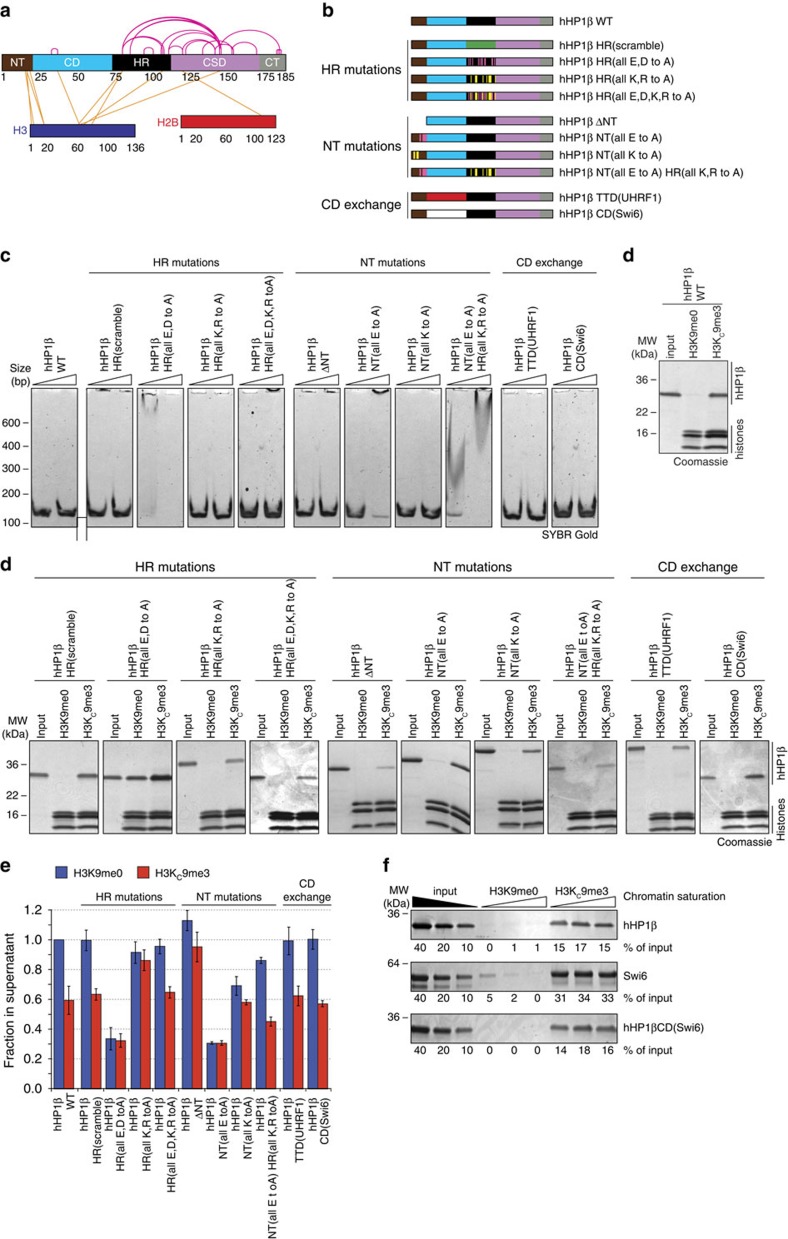
Figure 5. Modulation of CD and CSD functions by the HR and NT of hHP1β.
(a) Scheme representing EDC cross-links identified within the hHP1β/H3KC9me3 oligonucleosome complex under conditions of chromatin clustering (13.4 nM H3KC9me3 oligonucleosomal arrays, 15 μM hHP1β, 100 mM NaCl) using mass spectrometry. For detailed listing of the crosslinks see Supplementary Data 1. (b) Schematic representation of hHP1β mutant proteins. (c) The indicated recombinant proteins were incubated with a DNA fragment of 150 bp at 500: 1 and 1,500: 1 molar ratio. Complexes were separated by PAGE. DNA was stained with SYBR Gold. (d) Chromatin coprecipitation of the indicated wild-type (WT) and mutant hHP1β proteins with oligonucleosomes. Precipitated material was run on SDS–PAGE and stained with Coomassie blue. Input, 10%. (e) Chromatin precipitation analysis of oligonucleosomes with hHP1β WT or mutant proteins under non-saturating conditions. DNA remaining in the supernatant after centrifugation was incubated with EtBr and measured by fluorescence reading. Data were normalized to DNA levels present in the H3K9me0 chromatin/hHP1β WT sample. Averages of three independent experiments are plotted; error bars represent s.d.; n=3. (f) Chromatin coprecipitation of the indicated proteins with oligonucleosomes reconstituted to different saturation (0.8: 1.0, 1.0: 1.0 and 1.0: 1.2 ratio of octamers to positioning sequences). Precipitated material was run on SDS–PAGE and stained with Coomassie blue. Intensity of bands was quantified in relation to the input. Representative experiment is shown.

