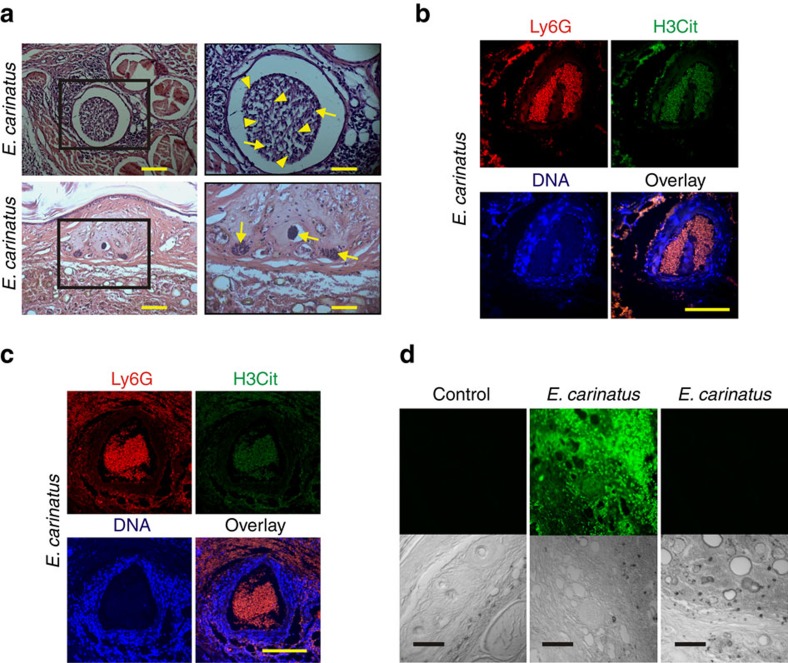
Figure 4. NETs block blood vessels, leading to accumulation of E. carinatus venom.
(a) Images of H&E-stained mouse tail tissue 8 h after E. carinatus venom (LD50) injection show clot formation in the mouse tail vein (top, left) and blocked blood capillaries (bottom, left). The respective enlarged images are shown on the right. Scale bars, 50 μm (left), 100 μm (right). Yellow arrowheads indicate NETs and yellow arrows indicate neutrophils. Immunofluorescence image of the mouse (n=4). (b) tail artery and (c) vein 8 h after E. carinatus venom (LD50) injection. Scale bars, 100 μm (n=4). (d) Immunofluorescence images show the accumulation of venom in E. carinatus venom (LD50)-injected mouse tail tissue section (top row, middle), section with a secondary antibody control (top row, right) and section of PBS-injected tail tissue, which served as a control (top, left). The corresponding differential interference contrast (DIC) images of the respective tissues are also shown (bottom row). Scale bars, 100 μm (n=4).

