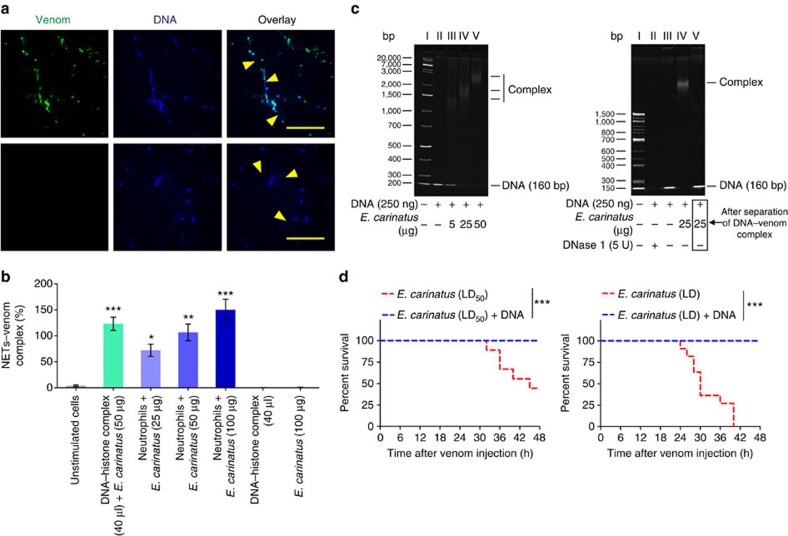
Figure 5. NETs capture E. carinatus venom toxins.
(a) Representative immunofluorescence image of neutrophils exposed to E. carinatus venom (50 μg ml−1) for 2.5 h; the venom was detected using rabbit polyclonal antibody against E. carinatus venom followed by an AlexaFluor 488-conjugated goat anti-rabbit antibody along with DNA stained by Hoechst stain (top row). The AlexaFluor 488-conjugated goat anti-rabbit secondary antibody control (bottom row). Yellow arrow heads indicate NETs. Scale bars, 100 μm (n=4). (b) The NET–venom complex was quantified using the DNA–venom capture ELISA assay. The results are expressed as a percent increase with respect to the unstimulated cells. The data are presented as mean±s.e.m. (n=4). *P<0.05, **P<0.01, ***P<0.001 versus the unstimulated cells; one-way analysis of variance, followed by Dunnett's post-hoc test. (c) Native PAGE (7.5%) showing the interaction between DNA and E. carinatus venom (left), as demonstrated by the dose-dependent retardation of the bands. Marker (lane I), 250 ng DNA (lane II), 250 ng DNA+5 μg E. carinatus venom (lane III), 250 ng DNA+25 μg E. carinatus venom (lane IV) and 250 ng DNA+50 μg E. carinatus venom (lane V). Recovery of DNA from the DNA–venom complex (right). Marker (lane I), 250 ng DNA+5 U DNase 1 (lane II), 250 ng DNA (lane III), 250 ng DNA+25 μg E. carinatus venom (lane IV) and recovered DNA from DNA+E. carinatus venom complex (lane V); n=3. (d) Kaplan–Meier survival curves show that the lethal potency of the E. carinatus venom is inhibited when it is incubated with DNA: E. carinatus venom, LD50 (red line, left) and LD (red line, right), and E. carinatus venom incubated with DNA for 10 min at 37 °C (blue line, both left and right); n=10. ***P<0.001. Log-rank test.

