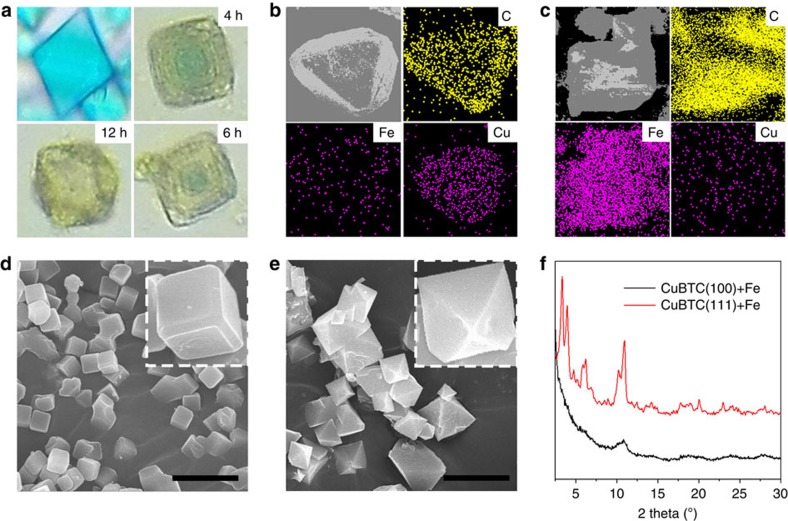
Figure 2. Transformation process from CuBTC to MIL-100.
(a) Optical microscopy images of CuBTC with different transformation time, the transformation was carried out under standing. (b) EDS mapping of the CuBTC/MIL-100 after transformation for 4 h and purification in methanol, Fe/Cu ratio is 23.5%. (c) EDS mapping of the CuBTC/MIL-100 after transformation for 12 h and purification in methanol and hot water, Cu/Fe ratio is 0.4%. (d) SEM images of the cubic CuBTC with mainly exposed {100} facet. Scale bar, 5 μm. (e) SEM images of the small octahedron CuBTC with mainly exposed {111} facet. (f) XRD patterns of cubic CuBTC and small octahedron CuBTC after transformation. Scale bar, 5 μm.

