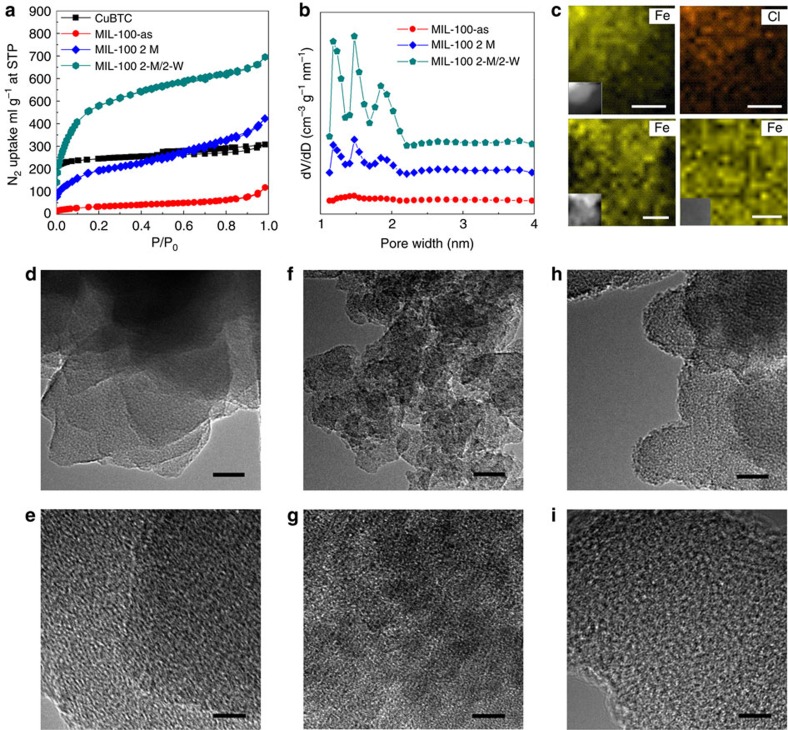
Figure 3. Characterization of MIL-100.
(a) N2 adsorption–desorption isotherms on MIL-100 with various purification cycles, showing the specific surface area reduced with the purification cycle, two cycles in methanol (2-M), two cycles in methanol and then in hot water at 70 °C (2-M/2-W). (b) Corresponding pore size distributions calculated by DFT method. (c) EDS mapping of the MIL-100 with different post-processing. Top two images: as-synthesized MIL-100 and demonstrating the well-dispersed chlorine, scale bar, 20 nm; bottom left image: as-synthesized MIL-100 after calcination at 200 °C for 4 h, scale bar, 10 nm; bottom right image: MIL-100 after purification; scale bar, 5 nm. (d,e) TEM images of as-synthesized MIL-100, showing the amorphous FeCl3 in the cavities. (f,g) TEM images of as-synthesized MIL-100 after calcination at 200 °C for 4 h, indicating the presence of nanoclusters in the cavities of the MIL-100. (h,i) TEM images of MIL-100 after purification, indicating clear porous structure and pure framework. Scale bar, 20 nm (in d,f,h); 5 nm (in e,g,i).

