
FIGURE 2.
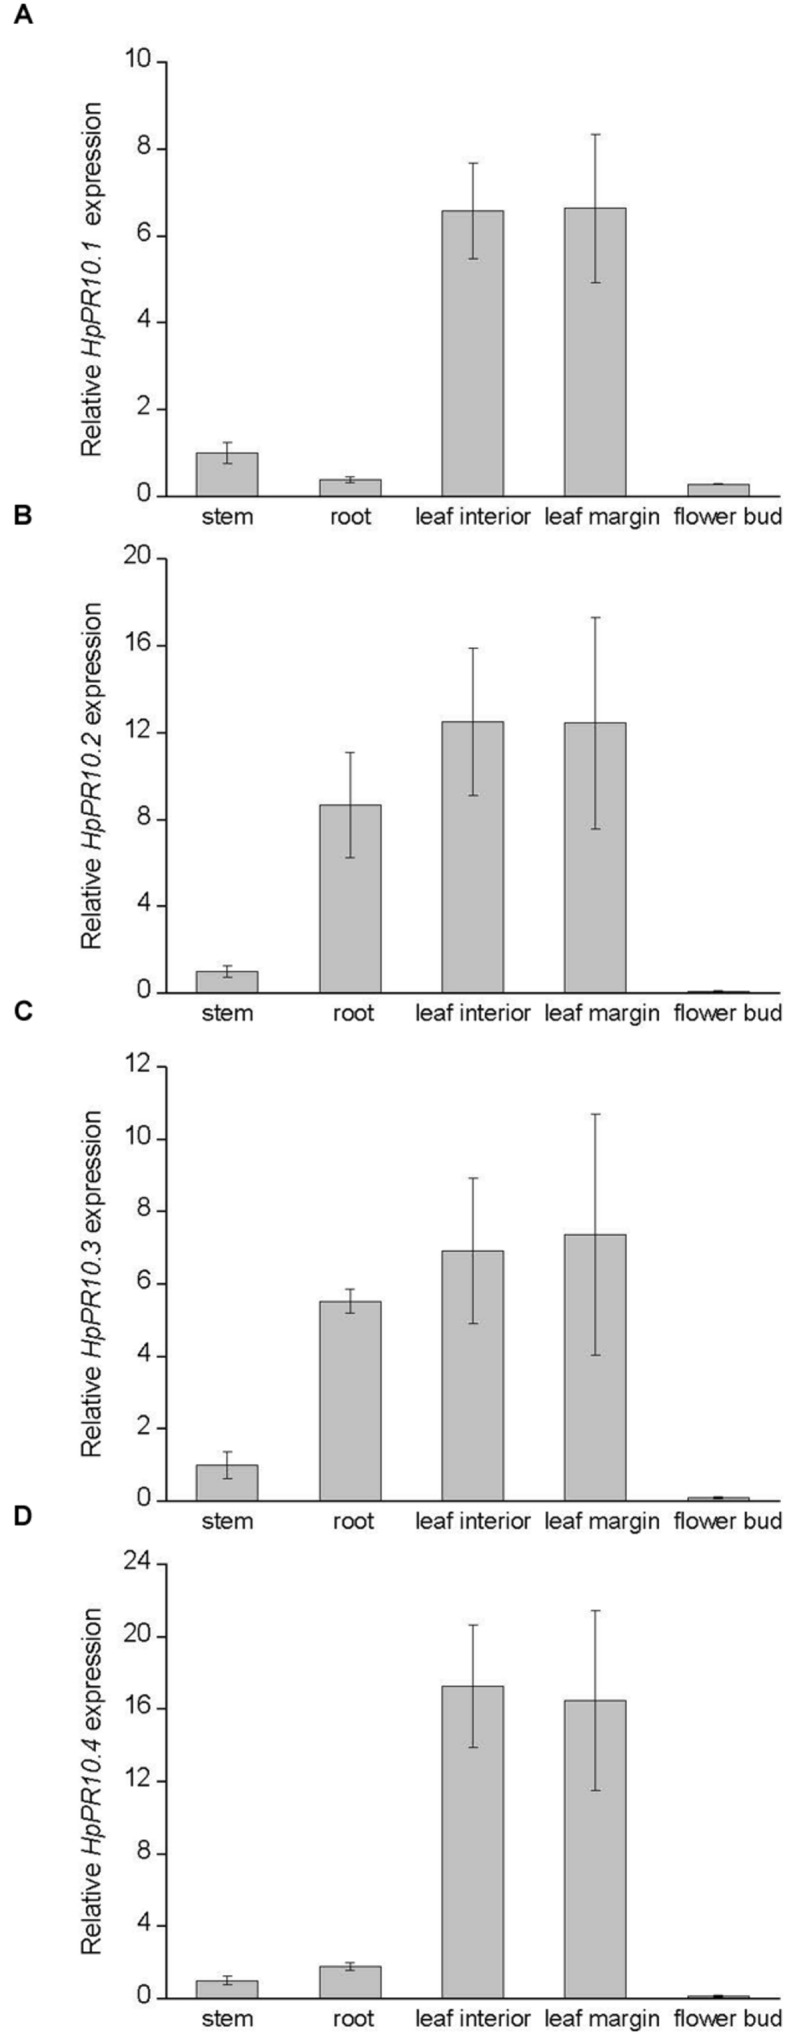
Expression of HpPR10.1 (hyp-1; A), HpPR10.2(B), HpPR10.3(C), and HpPR10.4(D) in H. perforatum tissues. The relative expression of the genes was quantified by qRT-PCR and normalized to GAPDH. Values represent means ± SE of three biological replicates.