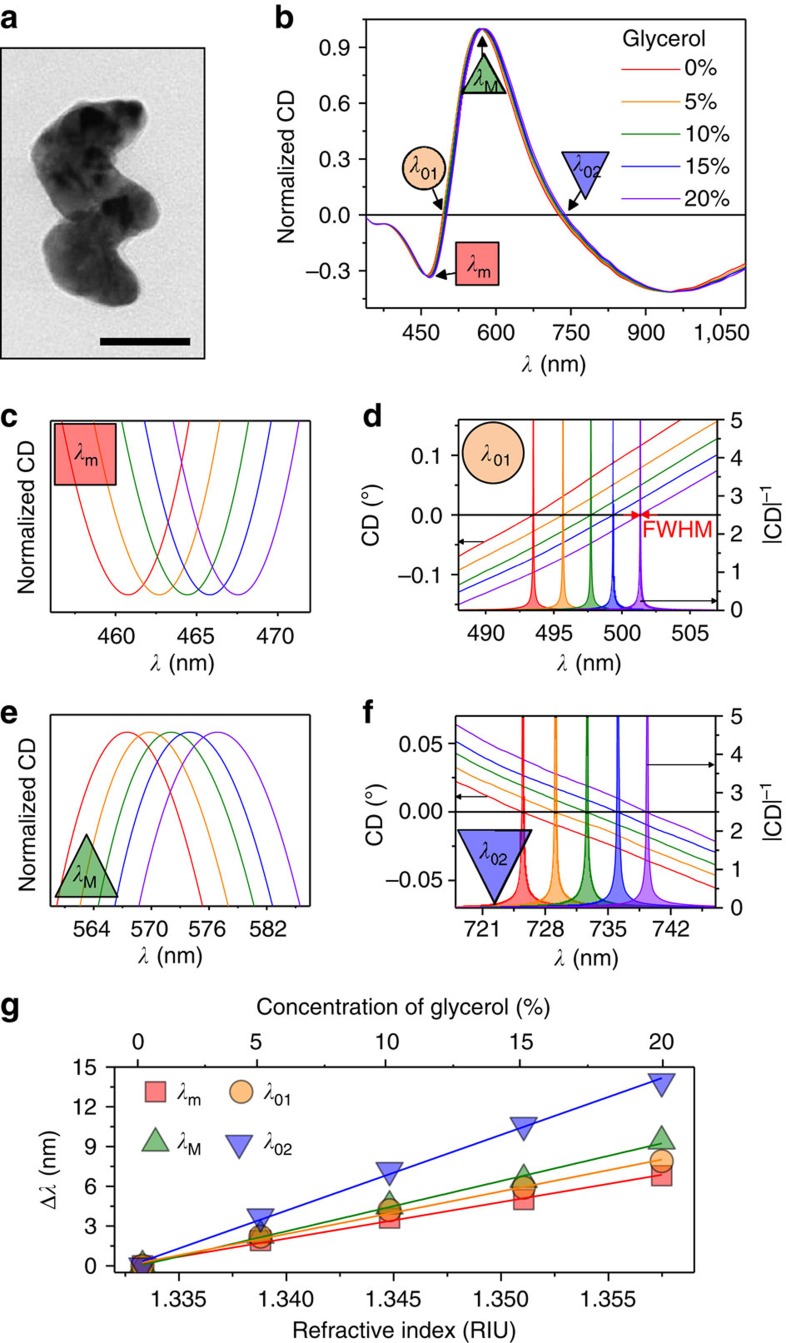
Figure 2. Bulk refractive index sensing.
(a) TEM image of a single Ag0.97Ti0.03:L2 nanohelix (Scale bar, 50 nm). (b) CD spectra of colloidal Ag0.97Ti0.03:L2 nanohelices in media of five different refractive indices (red: 0%, orange: 5%, green: 10%, blue: 15% and violet: 20% glycerol-water mixtures) over the full spectral range and detailed plots of the resonance shifts at (c) λm (red square), (d) λ01 (orange circle), (e) λM (green top triangle) and (f) λ02 (blue bottom triangle). For d and f the filled curves represent |CD|−1. (g) Wavelength shift, relative to water, of the four spectral features as functions of the glycerol-water concentration (top x axis) and its corresponding n (bottom x axis).

