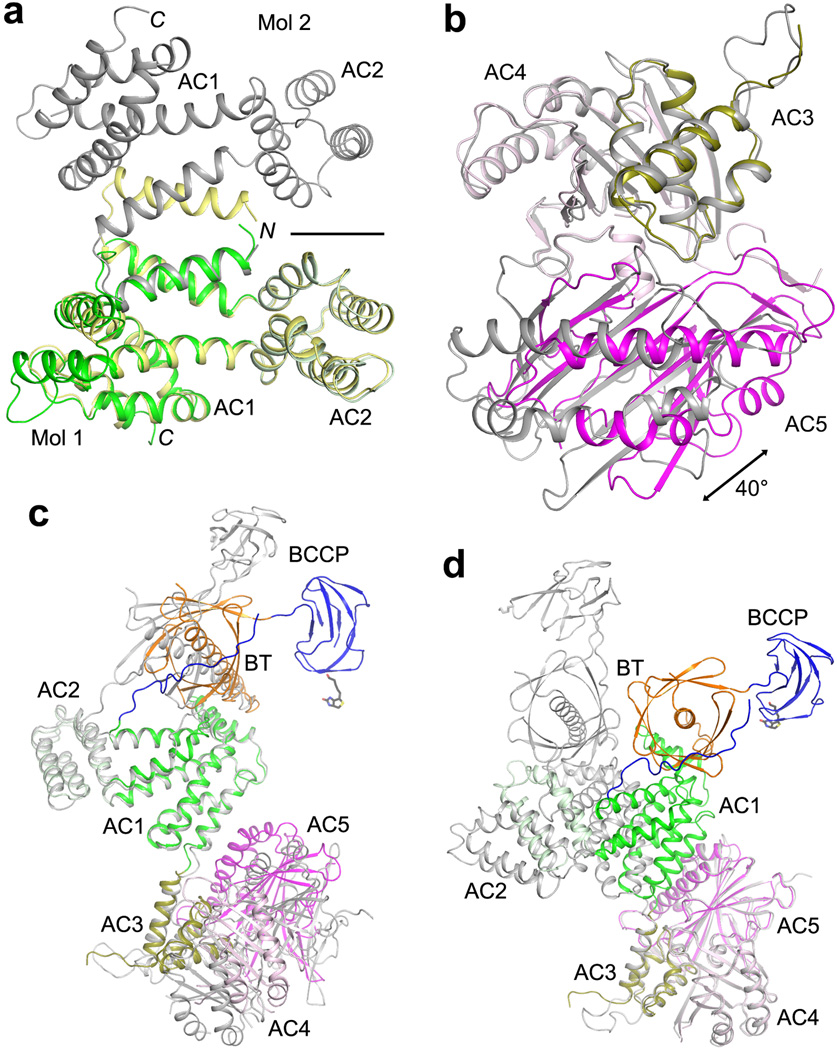
Extended Data Fig. 9.
Comparisons of the structures of ACC central region alone with that in the holoenzyme. (a). Overlay of AC1–2 in the holoenzyme (color) with AC1–2 alone (yellow and gray). The first helix is swapped between two monomers in the structure of AC1–2 alone, and the two-fold axis of that dimer is indicated with the black line. (b). Overlay of AC3–5 in the holoenzyme (color) with AC3–5 alone (gray), based on AC3–4. A large difference is seen for the orientation of AC5. (c). Overlay of BT-BCCP-AC1–5 in the holoenzyme (color) with these domains alone (gray), based on AC1–2. Large differences are seen for BT, BCCP and AC3–5. (d). Overlay of BT-BCCP-AC1–5 in the holoenzyme (color) with these domains alone (gray), based on AC3–4. Large differences are seen for BT, BCCP and AC1–2, although AC5 has essentially the same position.

