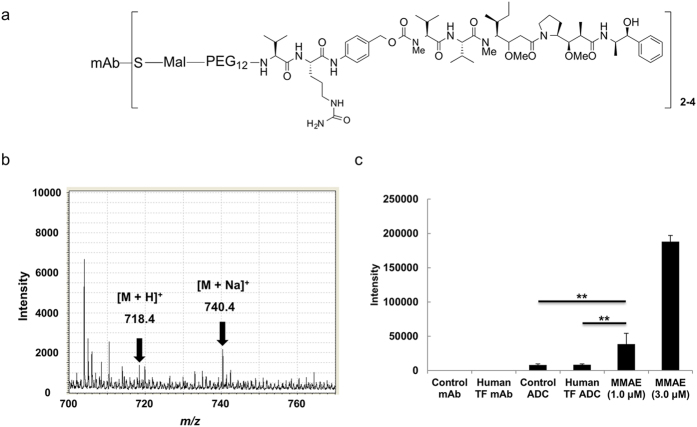
Figure 3. Selective detection of MMAE alone over MMAE conjugated to mAb using MALDI-IMS.
(a) The DAR of the ADCs was 2–4. A CHCA solution (10 mg/mL, 1.0 μL) was used for the ionization of mAbs (1.0 μM, 1.0 μL), ADCs (1.0 μM, 1.0 μL) and MMAE (1.0 and 3.0 μM, 1.0 μL). (b) The mass spectrum of human TF ADC (1.0 μM, 1.0 μL) is indicated. (c) The intensities (m/z 740.4) of the mAbs, ADCs, and each MMAE sample were measured with MS (Tukey-Kramer, **P < 0.01, N = 3 for each group). The intensity was expressed as the mean ± SD. Pixel size, 20 μm; measurement area, 200 × 200 μm.

