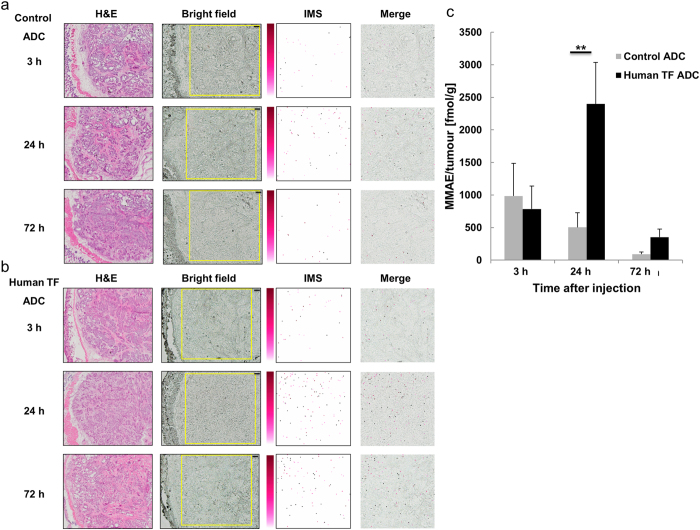
Figure 4. Visualization of MMAE released from ADCs in tumour tissues using MALDI-IMS.
(a) H&E staining is shown in the left column (original magnification, x5). The yellow rectangles on the bright field show the measurement area (2500 × 2500 μm). Pixel size, 20 μm; scale bar, 200 μm. (a,b) The images obtained from m/z 496.3 using MALDI-IMS for detection of MMAE in tumour tissues are shown as pseudo-colour images (Red-Purple). The 5.0-mg/mL CHCA solution was applied with a pinpoint spray gun. Minimum intensity, 4; maximum intensity, 10. Each merged image was superposed with the IMS image on the measurement area image obtained 3, 24, and 72 h after the administration of the ADCs. At 24 h after the administration of the ADCs, the accumulation of MMAE released from human TF ADC was visibly higher than that of the control ADC. (c) The contents of MMAE in the tumour tissues 3, 24, and 72 h after the administration of the control ADC were 985 ± 500, 504 ± 222, and 92 ± 31 fmol/g (mean ± SD, N = 5 for each group), respectively. The contents of MMAE in the tumour tissues 3, 24, and 72 h after the administration of the human TF ADC were 785 ± 354, 2399 ± 637, and 353 ± 125 fmol/g (mean ± SD, N = 5 for each group), respectively. There was a significant difference between the contents of the control ADC and human TF ADC 24 h after administration (Tukey-Kramer, **P < 0.01, N = 5 for each group).

