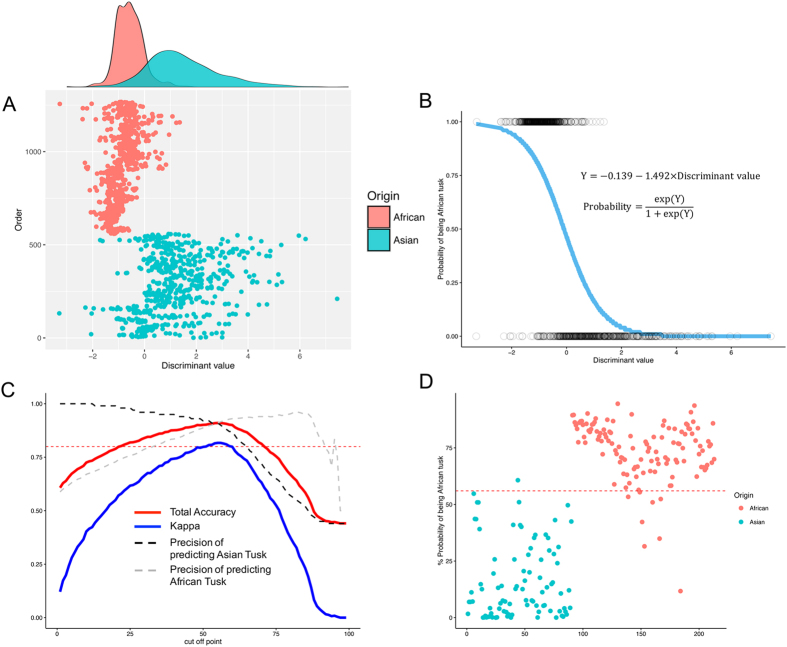
Figure 5. Effectiveness of the elemental composition data for estimating origin of elephant tusks.
(A) Scatter plot and density of values using discriminant analysis with Zr as the denominator based on scans of 72 Asian and 85 African tusks. (B) Predicting Asian or African tusk origins (Asian = 0, African = 1) as a function of the discriminant values (DV) subjected to Bayesian logit regression, referred as to a Bayesian hybrid classification model. Data of DV are indicated by the dots according to tusk species. (C) The set of cut-off values for predicting Asian or African tusk origin. Dashed red line shows the level of kappa at 0.8. (D) Scatter plot testing the reliability of the model for estimating tusk origin for 30 Asian and 41 African tusks with a cut-off value of 55% (dashed red line).

