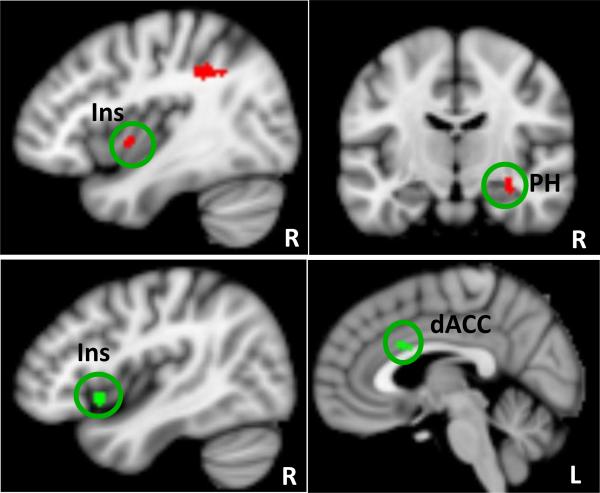
Figure 2.
Red (top row) indicates brain regions that showed significant FC decrease with the default mode network (DMN) in the tVNS group as compared to stVNS. Green color (bottom row) indicates brain regions whose DMN FC changes (post- minus pre-treatment) are positively associated with the corresponding HAMD score changes across all subjects. dACC: dorsal anterior cingulate cortex; Ins: insula; PH: parahippocampus; L: left; R: right.

