
Figure 3.
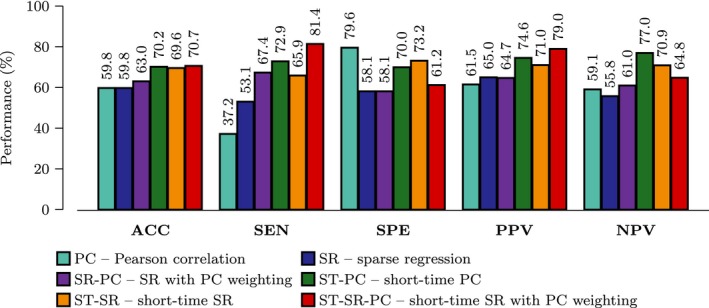
Performance Evaluation. Performance comparison for single‐ and multinetwork approaches using data from NYU. (ACC = ACCuracy, SEN = SENsitivity, SPE = SPEcificity, PPV = Positive Predictive Value, NPV = Negative Predictive Value).
Official websites use .gov
A
.gov website belongs to an official
government organization in the United States.
Secure .gov websites use HTTPS
A lock (
) or https:// means you've safely
connected to the .gov website. Share sensitive
information only on official, secure websites.
Performance Evaluation. Performance comparison for single‐ and multinetwork approaches using data from NYU. (ACC = ACCuracy, SEN = SENsitivity, SPE = SPEcificity, PPV = Positive Predictive Value, NPV = Negative Predictive Value).