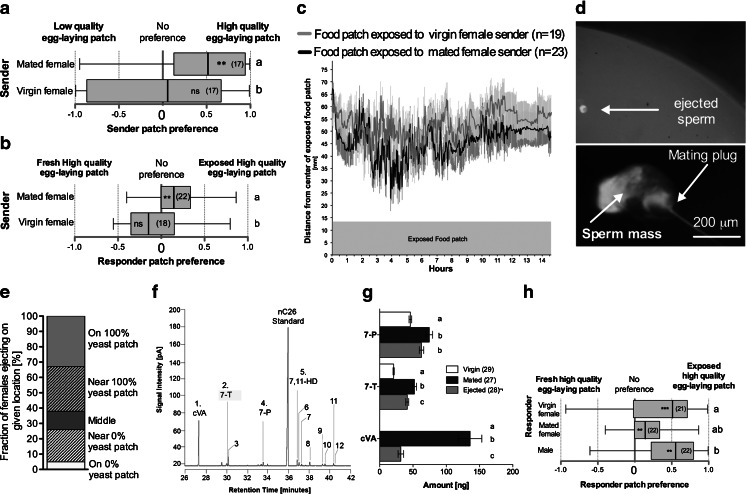
Fig. 2.
Mated females preferentially visit and eject sperm next to favorable egg-laying sites. a Preference of mated or virgin sender females for more time near a high (100 % yeast) or low (o% yeast) quality egg-laying patch. b Preference of responder mated females, in terms of location next to two egg-laying patches of equal quality, one of which was previously housed with either a mated or a virgin wild-type female. c Distance of responder mated females, determined every 2 min over 14 hr, next to two egg-laying patches of equal quality, one of which was previously exposed to either a mated or a virgin wild-type female. d Micrograph of a green fluorescent protein-fluorescing ejected sperm. The top micrograph shows an ejected sperm deposited on a patch of food, the bottom one shows the different parts of the ejected sperm. e Proportion of females that ejected sperm near a high (100 % yeast) or low quality (0 % yeast) egg-laying patch. f Gas chromatogram (flame ionization detection) of a hexane extract of a single sperm ejection. cVA = cis-11-vaccenyl acetate, 7,11-HD = (7Z,11Z)-heptacosadiene, 7-T = (Z)-7-tricosene, and 7-P = (Z)-7-pentacosene. Identities and quantification of the numbered peaks are given in Supplementary Table 1. g Mean amount of male- and female-specific cuticular hydrocarbons found in extracts of single females of the indicated mating status. Histograms labeled with different letters are different for the given compound as determined by Kruskal-Wallis ANOVA (for details, see Table S2). h Mated or virgin females and male responder preference between two food patches, one of which was previously exposed to a mated female. Error bars indicate S.E.M. Preference for a site is indicated in each box plot by asterisks (n.s.: not significant; ***, P < 0.001), as determined by a two-tailed exact Wilcoxon signed rank test. Different letters to the right of the box plots indicate differences between groups, as determined by a logistic regression; see Table S4 for full statistics

