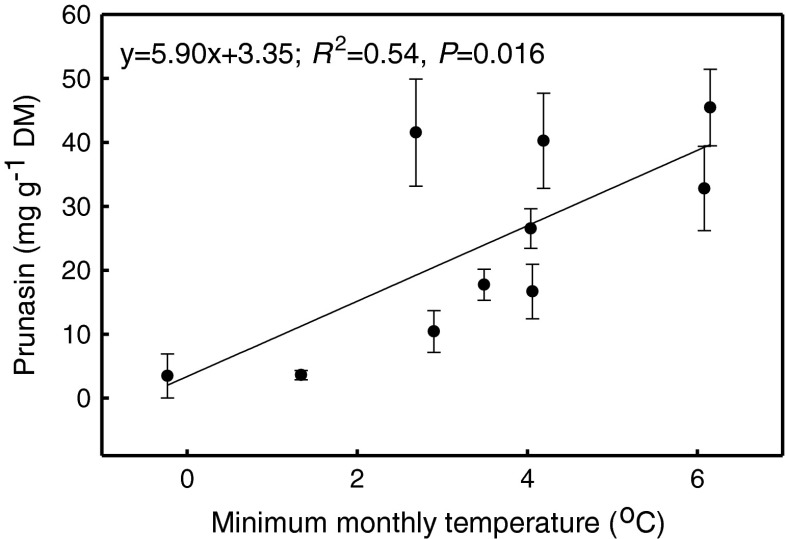
Fig. 1.
The relationship between the minimum monthly temperature and mean prunasin concentrations (means ± SE) in roots of Prunus serotina. Prunasin concentration was determined in May, June, August, and September. The equation of linear regression, coefficient of determination (R 2) with probability (P) obtained from the analysis of variance in regression are given (N = 10, N – pairs of the values of minimum monthly temperature and mean prunasin concentration per light treatment)

