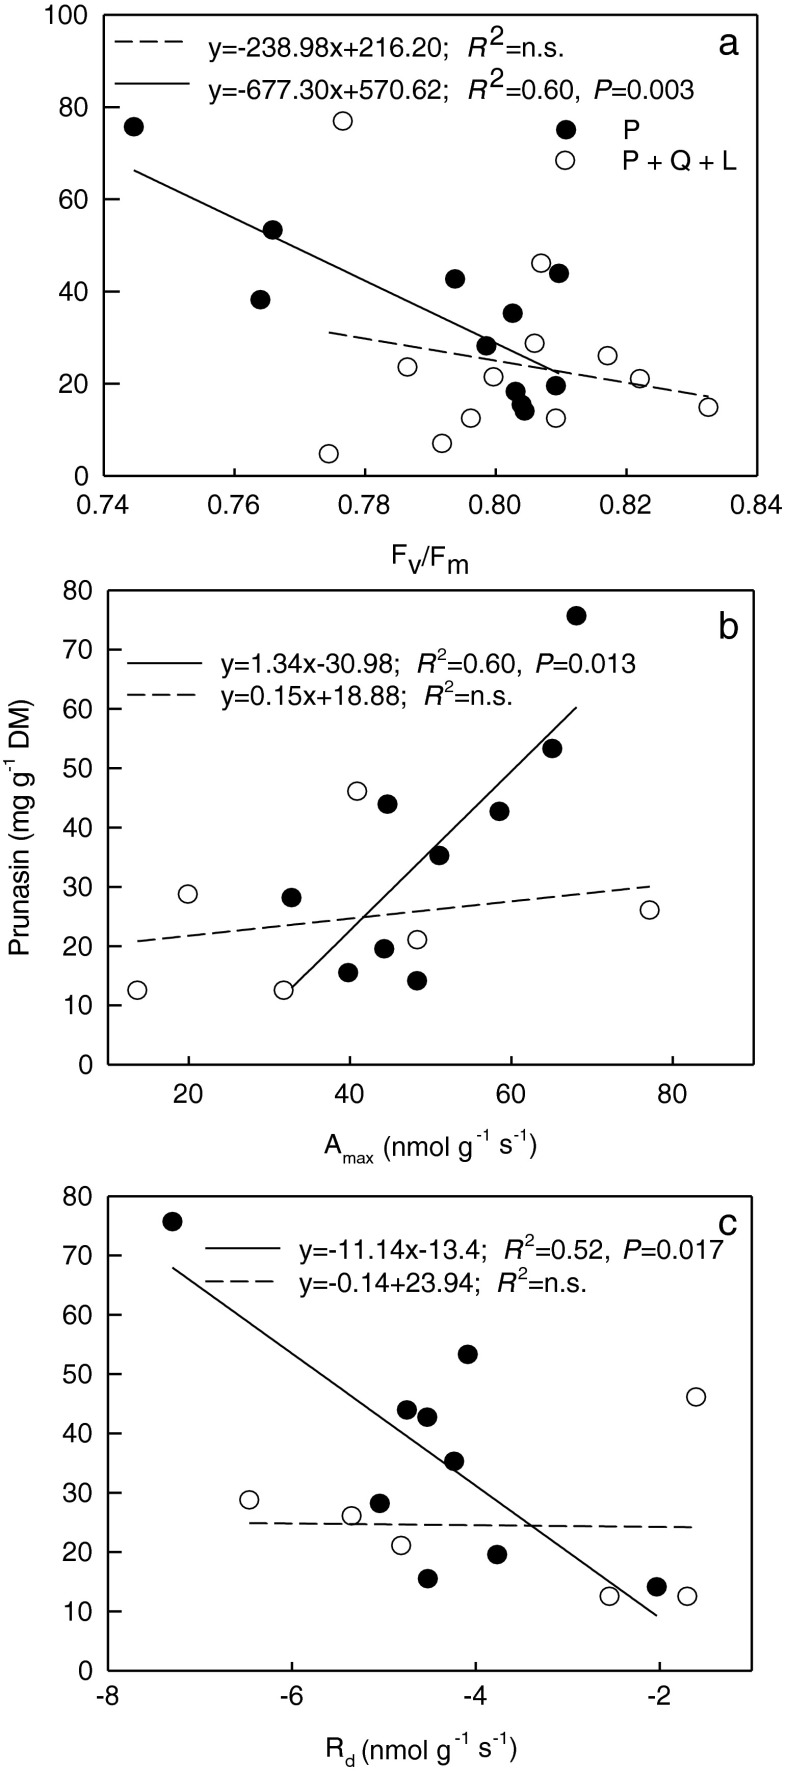
Fig. 3.
The linear regression between the photosynthetic parameters and prunasin concentration in roots of Prunus serotina seedlings growing in control (P – three Prunus seedlings) or in competition with mulching (Q + P + L - three Quercus petraea + six P. serotina + mulching with P. serotina leaves) under high light: a. Maximum quantum yield of PS II photochemistry (F v/F m); b. Maximum net CO2 assimilation rate (A max); c. Dark respiration (R d) vs. prunasin concentration in Prunus serotina roots. The equations of linear regression, coefficients of determination (R 2) with probability (P) obtained from the analysis of variance in regression are shown (N = 9 − 11)

