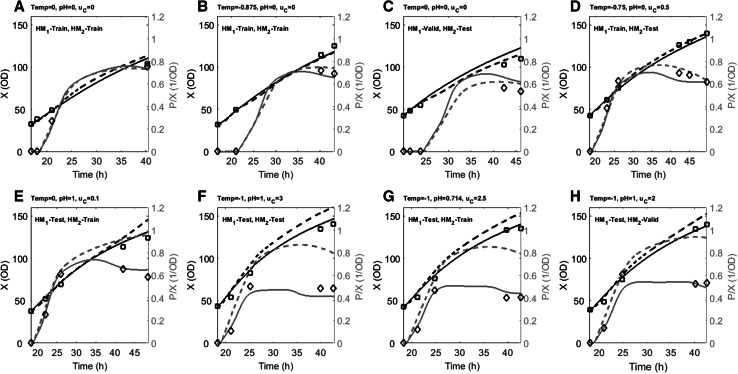
Fig. 3.
Dynamic profiles for HM1 (dashed lines) and HM2 (continuous lines) model estimates for biomass and scaled specific productivity and their respective experimental data points (squares biomass, diamonds P/X). Selected batches at different process conditions that are indicated above the graphs. Biomass at induction can be derived from the graph. Top row conditions within DoE 1 design space. Bottom row conditions outside DoE 1 design space. Note that due to variation in induction periods and sampling frequencies, different time spans are covered for different batches

