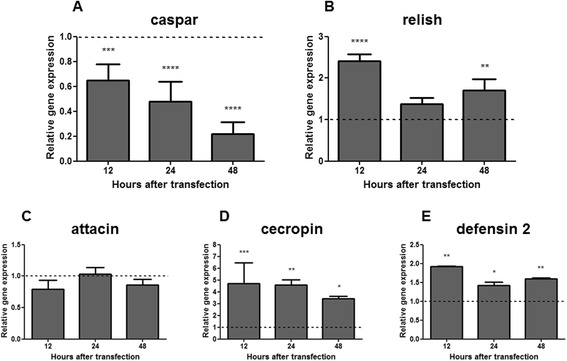
Fig. 2.

Caspar silencing and relative gene expression of the AMPs attacin, cecropin, defensin 2 and transcription factor relish determined by qPCR: a Gene expression of the Imd pathway repressor caspar in embryonic LL5 cells transfected with caspar dsRNA; b, c, d and e Gene expression of the AMPs attacin, cecropin and defensin 2, and the transcription factor relish in LL5 after caspar silencing. Quantifications were normalized relative to the housekeeping gene rp49, and relative gene expression expressed as fold change calculated relative to unchallenged control group. Dotted line indicates the gene expression of controls transfected with luciferase dsRNA. Bars represent the SEM of two biological replicates from independent experiments collected at 12, 24 and 48 h post dsRNA transfection. ANOVA test with multiple comparisons of Games-Howell or Tukey was used. Bonferroni correction was used in the analyses of the samples. P-values: *P < 0.05; **P < 0.01; ***P < 0.001; ****P < 0.0001
