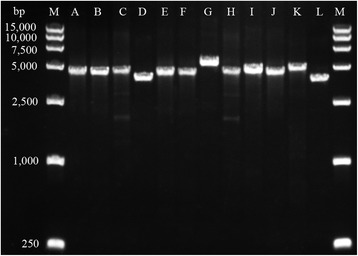
Fig. 3.

Agarose gel electrophoresis of PCR products obtained with primers I and X for 12 isolates. primers I and X and the region correspond to Fig. 1. The following types corresponding to the Fig. 2 were showed by lane: 1, marker; 2 A; 3, B; 4, C; 5, D; 6, E; 7, F; 8, G; 9, H; 10, I; 11, J; 12, K; 13, L; 14, marker
