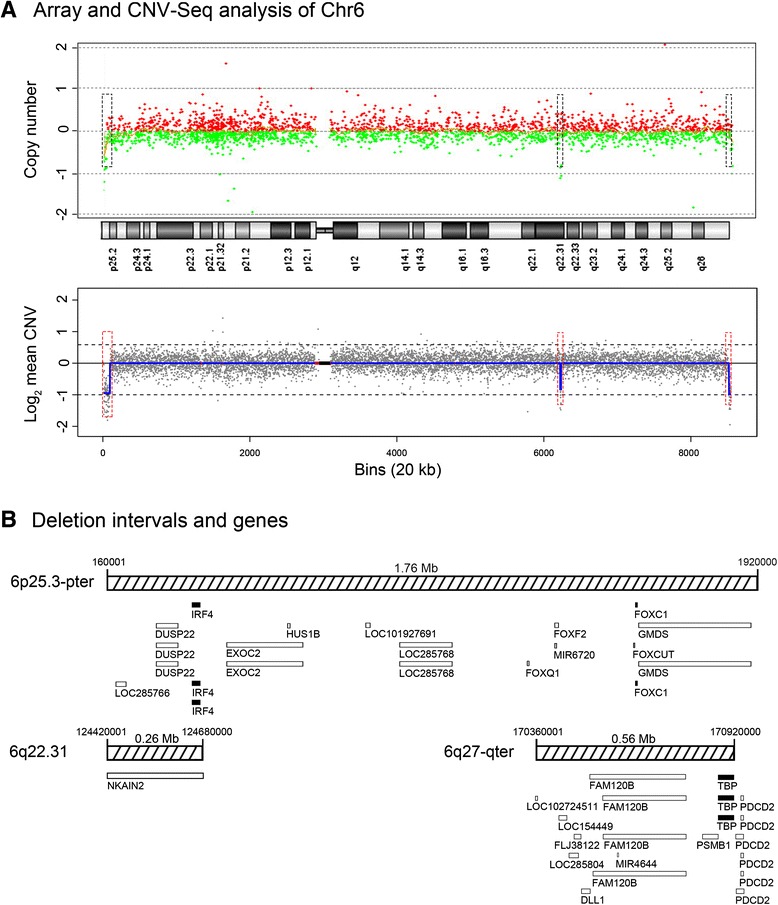
Fig. 3.

High-resolution analysis of r6 microdeletions and associated genes. a CMA and NGS copy number plots for chromosome 6. The array CGH plot is shown as copy number (Y-axis) versus cytogenetics co-ordinates. Red dots indicate chromosomal gain and green dots indicate chromosomal loss. The NGS chromosome 6 plot is shown as log2 mean CNV (Y-axis) versus 20 kb sequencing bins (X-axis). The blue line along chromosome 6 tracks the mean CNV. The upper dashed line represents a 100 % chromosome gain [log2(1.5)] and the lower dashed line represents a 100 % chromosome loss [log2(0.5)]. Red lines indicate regions of repetitive sequences and the black box marks the centromere. Three microdeletions were identified (red dashed boxes); 6p25.3-pter (detected by CMA and NGS), 6q22.31 (detected by NGS) and 6q27-qter (detected by NGS). b Gene deletion intervals. The relative size and position of UCSC database reference genes in the three intervals is shown. Open boxes represent non-disease genes and solid black boxes represent disease-genes, according to OMIM database
