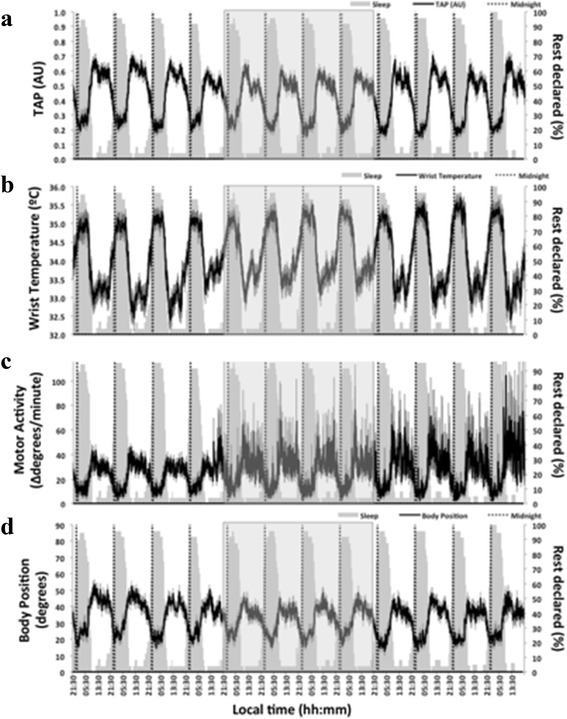
Fig. 1.

Twelve-day ambulatory mean recording of TAP (a), wrist temperature (b), motor activity (c) and body position (d) (n = 24) during the study period. The mean of each variable is represented as a black line, and the SEM as a vertical grey line. Rest declared denotes the percentage of patients that declared being asleep at each time point, and is represented as a grey area on each graph for terms of comparison. The chemotherapy period is highlighted by a light grey square
