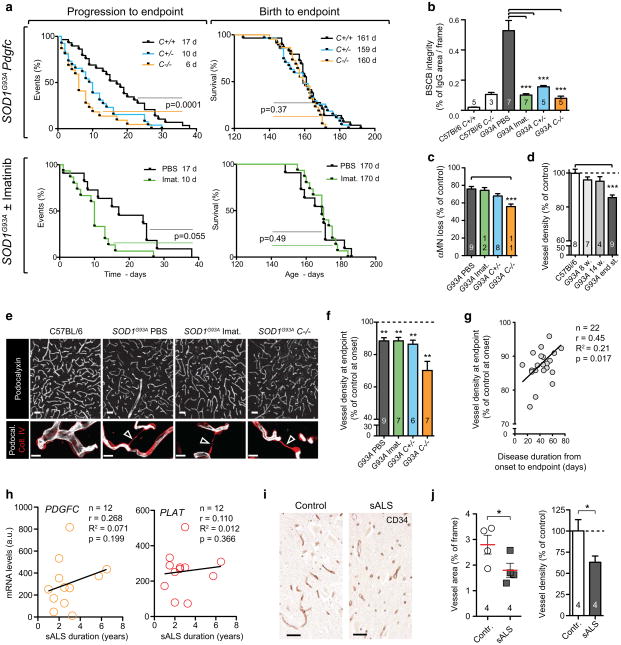
Fig. 3.
Vascular regression occurs despite BSCB restoration and correlates with disease severity. a Event estimates of endpoint survival from birth and disease progression to endpoint phase. SOD1G93APdgfc+/+ (n = 32) or SOD1G93A PBS-treated mice (black, n = 17) are compared to SOD1G93APdgfc−/− (orange, n = 23), SOD1G93APdgfc+/− (turquoise, n = 33) and SOD1G93A treated with 100 mg/kg/day imatinib from the age of 8 weeks (green, n = 19). p values for Gehan–Breslow–Wilcoxon tests are indicated and median onset values are shown in legends. b BSCB integrity determined by IgG quantification in endpoint SOD1G93A mice treated with PBS (n = 7), imatinib (n = 7, ***p = 0.0001), SOD1G93APdgfc+/− (n = 5, ***p = 0.0001) and SOD1G93APdgfc−/− (n = 5, ***p = 0.0001). Mean ± s.e.m, two-tailed Mann–Whitney test. c Motor neuron loss in endpoint SOD1G93A mice treated with PBS (n = 9), imatinib (n = 12) and SOD1G93APdgfc−/− (n = 11, ***p = 0.0001), data are presented as % of genotype control without SOD1G93A. Mean ± s.e.m, two-tailed t test. d Vascular regression in the ventral horn of SOD1G93A calculated as skeletonised vessel length and referenced to C57Bl/6 (n = 8), SOD1G93A (n = 9, ***p = 0.0001). Mean ± s.e.m, two-tailed t test. e Vascular network in the ventral horn at disease endpoint visualised with podocalyxin staining (white, bar 50 μm) and basement membrane collagen IV (red) to visualise empty collagen sleeves (lower panel arrowheads), bar 10 μm. f Quantification of vascular density at disease endpoint in SOD1G93A mice treated with PBS (n = 9, **p = 0.007) as well as in mice with restored BSCB properties: imatinib (n = 7, **p = 0.009), SOD1G93APdgfc+/− (n = 6, **p = 0.004) or SOD1G93APdgfc−/− (n = 7, **p = 0.003). Values are related to respective SOD1G93APdgfc allele control at onset age of 14 weeks. Mean ± s.e.m, two-tailed t test. g Positive correlation between vascular regression from panel f and disease duration after onset. Results from SOD1G93A PBS-treated, SOD1G93A imatinib-treated and SOD1G93APdgfc+/− mice were grouped and correlation is indicated with a black line. h Lack of correlation between neuronal PDGFC or PLAT mRNA expression and duration of sALS. i Vascular network in spinal cord ventral horn in sALS patients stained with the CD34 antibody. Staining target is indicated in the upper right corner. Bar 50 μm. j Vascular density in sALS patients quantified as vessel area or skeletonised fragment length density (n = 4). Mean ± s.e.m, one-tailed t test

