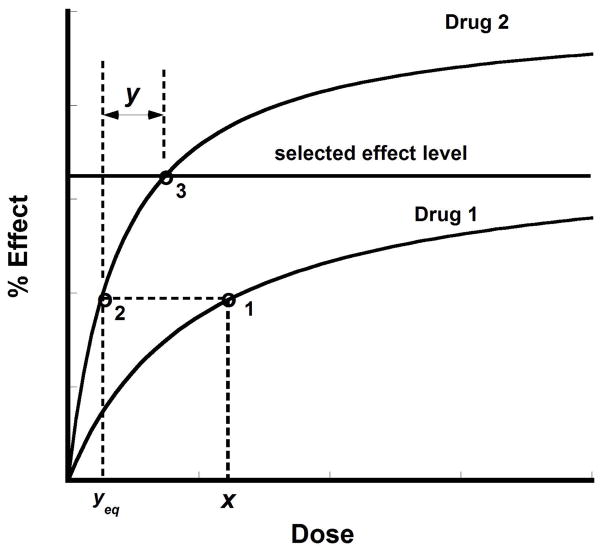
Fig. 9.19.5.
The additive combination (x,y) is graphically illustrated. It is seen that dose x of drug 1 has an equivalent dose of drug 2 that is denoted yeq. When viewed as drug 2 its effect is at point 2. In order to get to the selected effect level at point 3, we need the quantity y and, thus, the pair (x,y) is a point on the isobole, and the set of all possible pair (x,y) gives the isobole graph.

