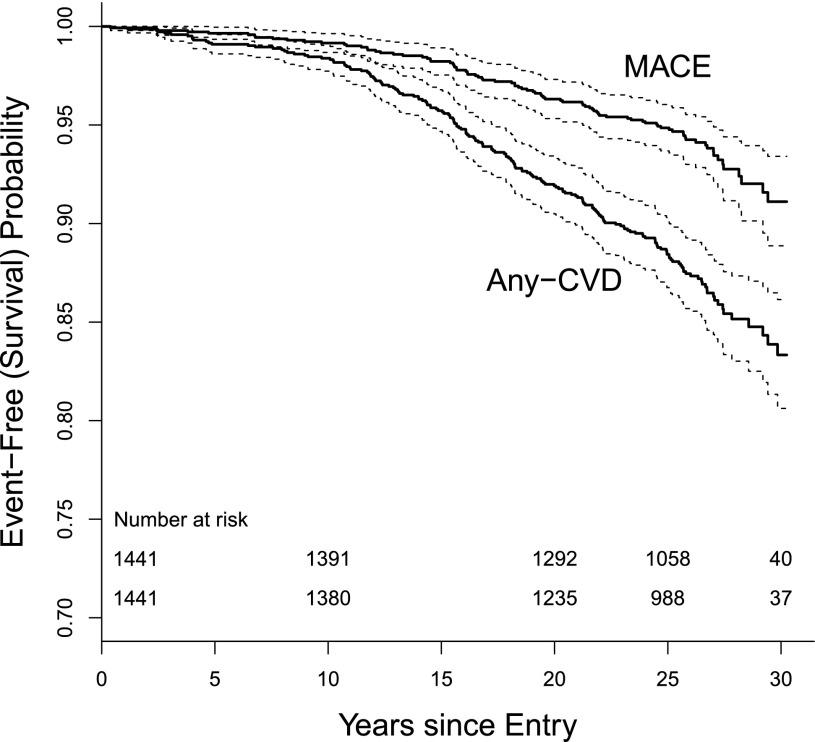
Figure 1.
Kaplan-Meier survival (event-free) curves (solid lines), and 95% CIs (dashed lines) for MACE (top line) and any-CVD (bottom line), with number of subjects at risk for each at 10, 20, and 30 years of follow-up. The number at risk beyond 23 years declines as a function of staggered entry into the study from 1983 to 1989.

