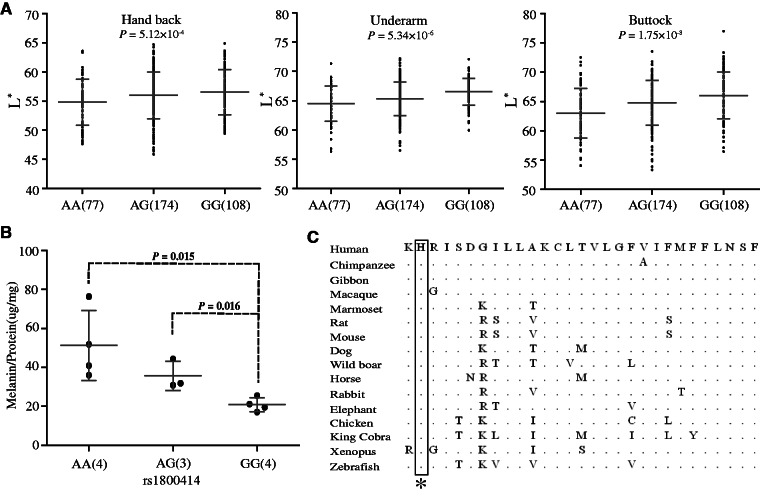
Fig. 3.
Genetic association of rs1800414 with skin pigmentation in northern Han Chinese. (A) Measurements of skin darkness (by L* value) of three rs1800414 genotypes. The P values (additive genetic model) are shown in the scatted plots. The y axis represents the L* value; the x axis shows three rs1800414 genotypes with sample sizes in the parentheses. The “error bar” indicates standard deviation. (B) The levels of melanin production in human foreskin melanocytes with different rs1800414 genotypes. Two-tailed t-test was used for statistical evaluation. The y axis represents relative abundance of melanin (Melanin/Protein, μg/mg); the x axis shows the three genotypes with sample size in parentheses. The error bar indicates standard deviation. (C) OCA2 protein sequence (human protein position 614–642) alignment among vertebrate species and rs1800414 (labeled with an asterisk) is highly conserved. The protein sequences were from NCBI (http://www.ncbi.nlm.nih.gov/, last accessed July 10, 2015).

