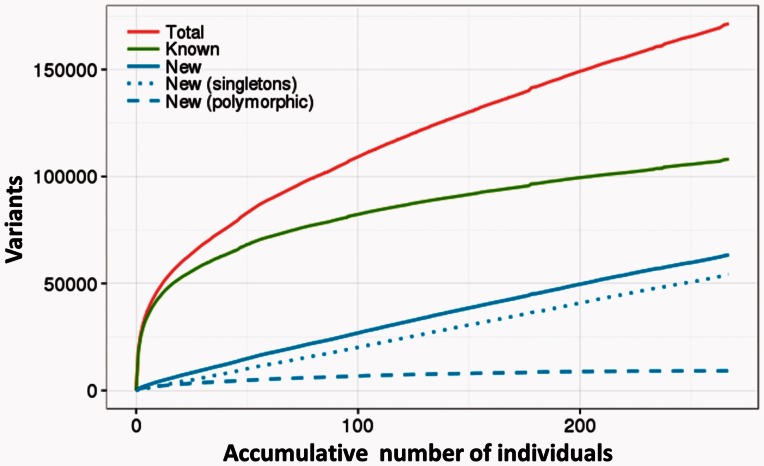
Fig. 1.
Accumulative number of new variants contributed by individuals. The red line represents the number of variants found as the number of sequenced individuals increase. The green line represents the number of already known variants among all the variants found. The blue line represents the number of new variants not present in the 1000G populations. New variants are decomposed into polymorphic variants (present in more than one individual in the MGP population) represented by the blue dashed line, and rare variants (present in only one MGP individual), represented by the blue dotted line.

