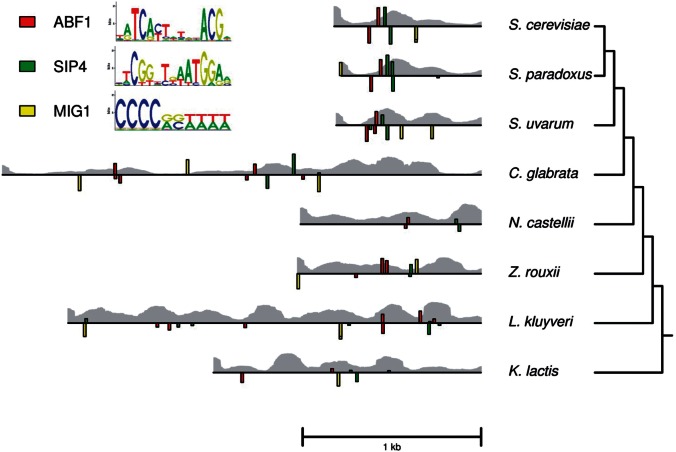
Fig. 1.
Transcription factor binding and nucleosome occupancy predictions for MLS1 promoters. The noncoding region upstream of the MLS1 start codon from eight yeast species, where the heights of colored bars represent the scores of predicted binding sites for Abf1, Sip4, and Mig1 based on PWMs from MacIsaac et al. (2006). Bars above each line represent sites on the forward strand and those below represent sites on the reverse strand. The probability of nucleosome occupancy at each base pair along the promoters is represented by the height of the gray bars in the background. Phylogenetic relations are based on Scannell et al. (2006).

