Fig. 3.
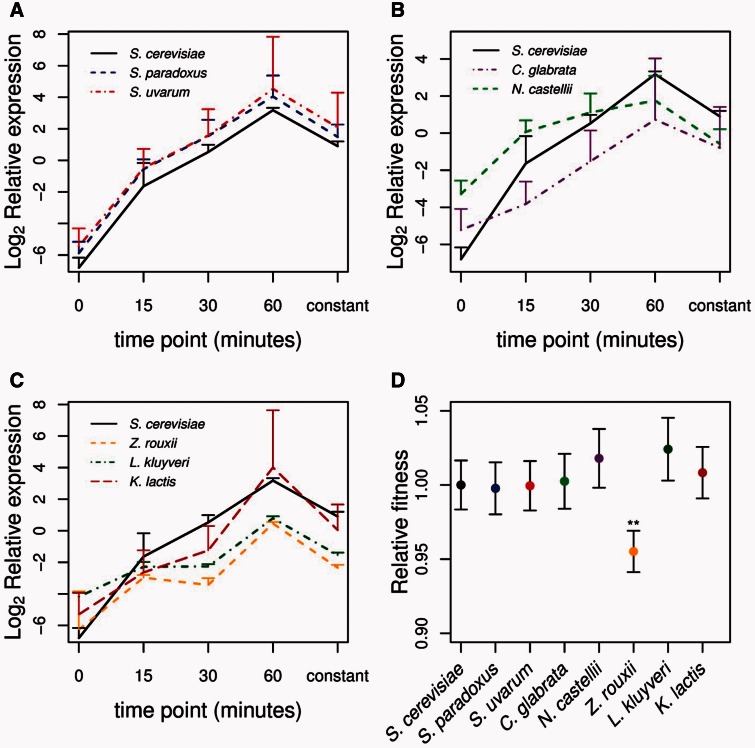
Gene expression and fitness of MLS1 promoters in a fluctuating environment. Changes in MLS1 expression for the eight species promoter constructs are shown in A–C and are divided into (A) Saccharomyces species, (B) post–whole-genome duplication species, and (C) pre–whole-genome duplication species. Relative expression levels represent the level of MLS1 relative to the housekeeping gene ACT1 on a log2 scale. Time point 0 is expression in complete media with 2% glucose and subsequent time points are expression levels 15, 30, and 60 min after being placed in complete media with 3% ethanol. The “constant” time point indicates expression after 24 h of exponential growth in ethanol media. Error bars indicate one standard deviation. Relative fitness of each MLS1 species promoter construct (D) measured as the growth rate of each strain relative to a fluorescent competitor strain after 3 days of sequential competition in complete media with 3% ethanol plus 0.2% glucose. Bonferroni corrected P values are indicated for *P < 0.05, **P < 0.01, and ***P < 0.001.

