Fig. 2.
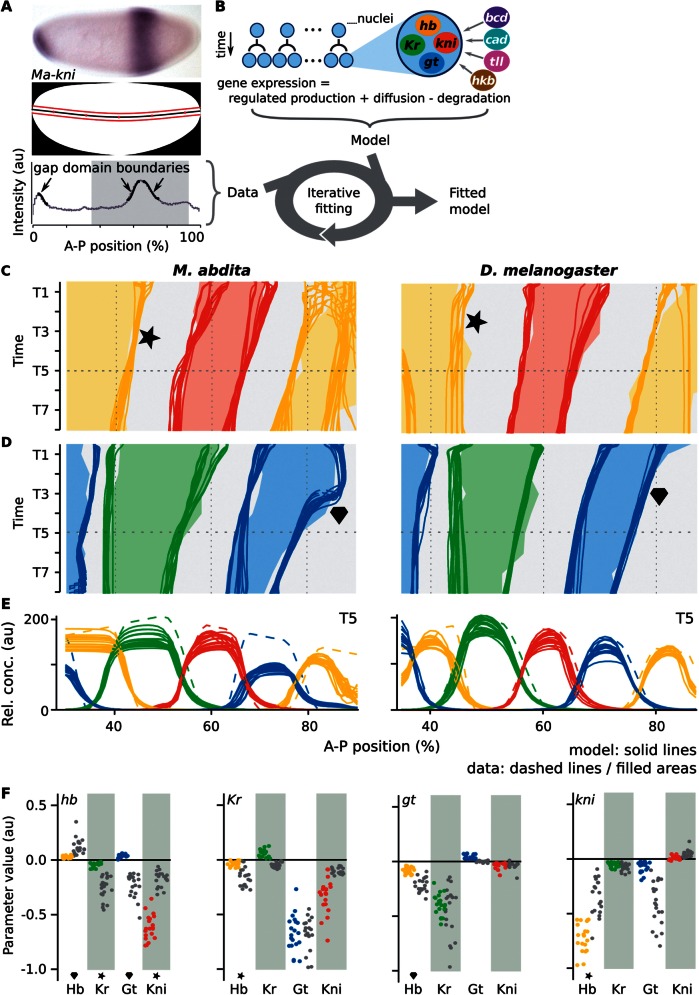
The gene circuit approach and resulting gap gene network models. (A) Data acquisition/processing. Top: Megaselia abdita whole-mount in situ hybridization showing kni mRNA expression at mid-blastoderm (C14-T3). Middle: Embryo mask showing dorsoventral midline (black) and 10%-strip used for extraction of expression profiles (bounded by red lines). In both panels, anterior is to the left, dorsal is up. Bottom: Extracted kni expression profile (gray) in arbitrary units (au); manually fitted spline curves used to extract boundary positions shown in black (arrows); gray background indicates the trunk region included in our models. (B) The gene circuit approach: A dynamical model—consisting of a row of dividing nuclei with gap gene regulation, diffusion, and decay—is fit to integrated expression data using a global optimization strategy. (C–E) mRNA expression data and gene circuit model output for M. abdita (left) and Drosophila melanogaster (right) during blastoderm cycle 14A (C14A; time classes T1–8); we show 20 selected gene circuits for each species. (C, D) Space–time plots show gap gene expression data (solid areas), overlaid with gene circuit model output (each independent model fit represented by a separate line). Areas/lines demarcate regions with relative mRNA concentrations above half-maximum value. Star indicates dynamic versus stationary behavior of the posterior hb boundary; diamond highlights differing shift dynamics of the posterior gt domain. (E) Gene expression data (dashed) and gene circuit model output (solid lines) at time class T5 (horizontal dashed line in [C] and [D]). A–P position in percent, where 0% is the anterior pole. (F) Comparison of interaction strengths for gap gene cross-regulation between species. Scatter plots show distributions of estimated parameter values from fitted and selected circuits in M. abdita (colored dots), and D. melanogaster (gray); target genes separated by panel where columns represent regulators. Stars/diamonds indicate interactions involved in corresponding features of expression dynamics highlighted in (C) and (D).

