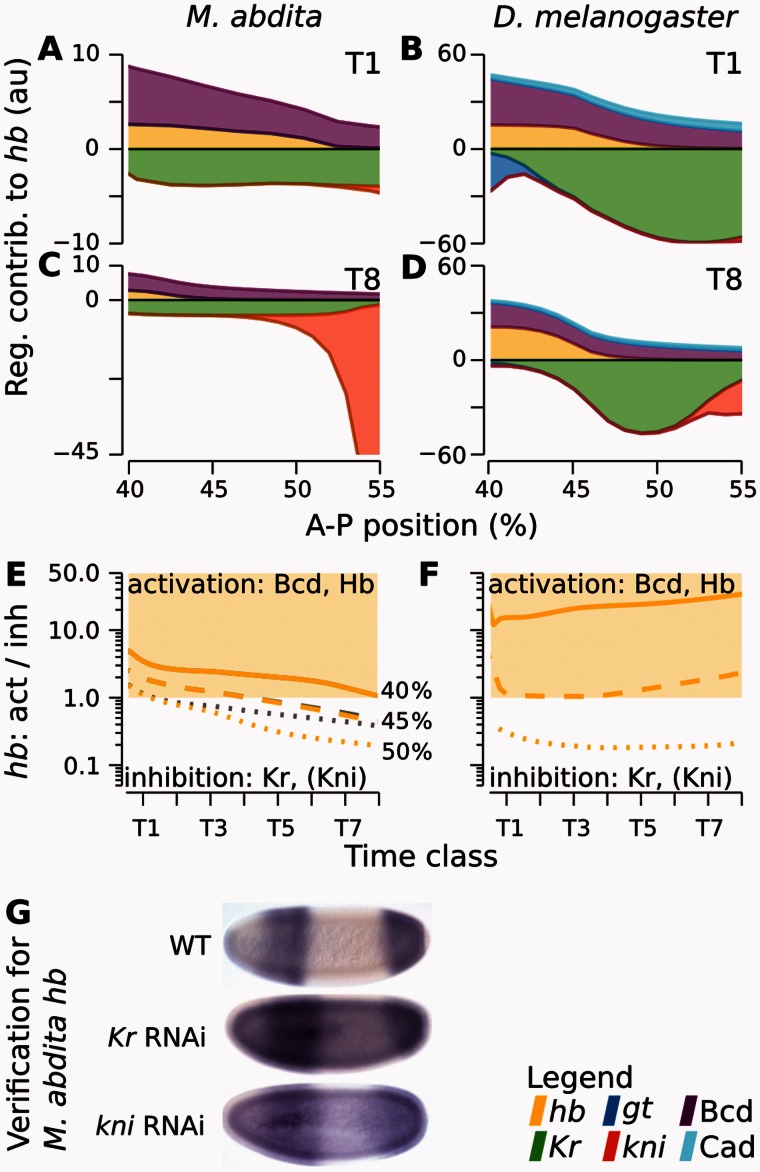
Fig. 3.
Graphical analysis of regulatory interactions involved in positioning the hb boundary. The left column of graphs shows Megaselia abdita, the right column Drosophila melanogaster. (A–D) Plots showing cumulative regulatory contributions of gap genes and external inputs to anterior hb in the region of its posterior boundary. Contributions are shown at time class T1 (A, B) and T8 (C, D). Each colored area corresponds to an individual regulatory term ( or ) in equation (3). Activating contributions are >0.0 and inhibiting contributions <0.0. (E, F) Plots show ratios of activating versus repressive regulatory input on hb, plotted over time for three equidistant nuclei at 40% (solid), 45% (dashed), and 50% (dotted) A–P position (gray lines exclude the additional repressor Kni, which is only active in the posterior-most nucleus at 50%). Light yellow areas indicate activation of hb (>1.0), white areas inhibition (<1.0). Comparing curves in E versus F reveals that Kr is sufficient to trigger hb downregulation in M. abdita, but not in D. melanogaster. (G) Embryos of wild-type (WT) and RNAi-treated M. abdita embryos stained for hb mRNA at time class T5. Embryos are shown in lateral view: Anterior is to the left, dorsal is up. Embryos represent illustrative examples drawn from a quantitative and systematic data set of M. abdita RNAi knockdowns (Wotton, Jiménez-Guri, Crombach, Janssens, et al. 2015).

