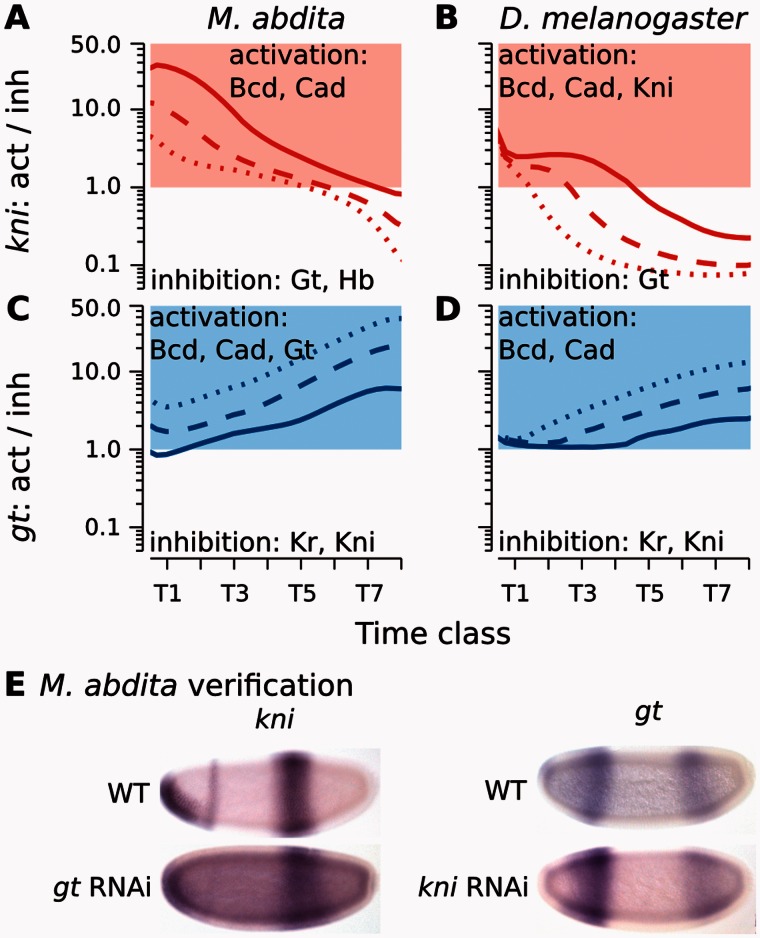
Fig. 5.
Graphical analysis of regulatory interactions involved in positioning the kni–gt boundary interface. (A–D) Plots show ratios of activating versus repressive regulatory input on kni (A, B) and gt (C, D) over time in Megaselia abdita (A, C) and Drosophila melanogaster (B, D). Lines indicate equidistant nuclei at 66% (solid), 68% (dashed), and 70% (dotted) A–P position (A, C), and 65% (solid), 67% (dashed), and 69% (dotted) A–P position, respectively (B, D). Red/blue colored areas indicate activation of kni/gt (>1.0), white areas indicate inhibition (<1.0). Despite subtle differences in shift mechanism and dynamics, both M. abdita and D. melanogaster show increasing kni repression and gt activation over time due to repressive asymmetry between the two genes. See main text for details. (E) Embryos of wild-type (WT) and RNAi-treated M. abdita embryos stained for kni and gt mRNA at time class T5. Embryos are shown in lateral view: Anterior is to the left, dorsal is up. Embryos represent illustrative examples drawn from a quantitative and systematic data set of M. abdita RNAi knockdowns (Wotton, Jiménez-Guri, Crombach, Janssens, et al. 2015).

