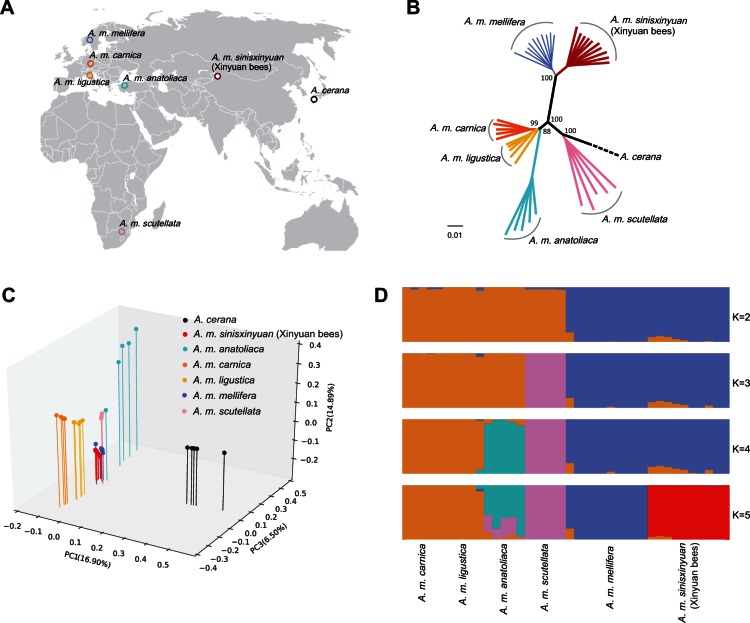
Fig. 1.
Population genetics. (A) Geographic locations of the studied honey bees. (B) Neighbor-joining phylogenetic tree of honey bee populations derived from 100 bootstrap replicates. The scale bar represents the evolutionary distances measured by p-distance. (C) Three-way PCA plots of honey bee populations. (D) Genetic structure of the honey bees. Analyses with frappe show the clustering of sample into 2–5 groups. The proportion of the individual’s genome from each ancestral population is shown by the length of each colored segment.

