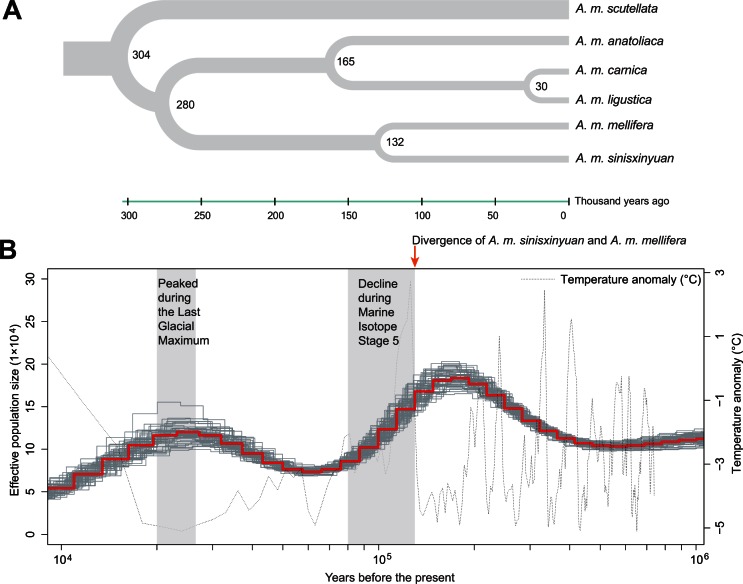
Fig. 2.
Population genetics and demographic history. (A) Time of divergence between populations. Number at each node represents the time of divergence in thousands of years. (B) Demographic history of Xinyuan bees (Apis mellifera sinisxinyuan). The red line indicates the effective population size measured by the scaled mutation rate per generation (0.53 × 10⁻⁸), the gray solid lines illustrate the PSMC estimates for 50 rounds of bootstrap. The generation time is 1 year. Shaded areas represent the Last Glacial Maximum (left) and Marine Isotope Stage 5 (right).

